Let's Break It Down
The graph of a trigonometric function gives you a visual representation of the function. You can use a graphing utility, such as a graphing calculator or DESMOS, to graph the function. All you have to do is type the equation in carefully and set the viewing window to frame the function well. Make sure, though, that the graphing utility is in radian mode so that you get an accurate graph. Let’s look at an example.
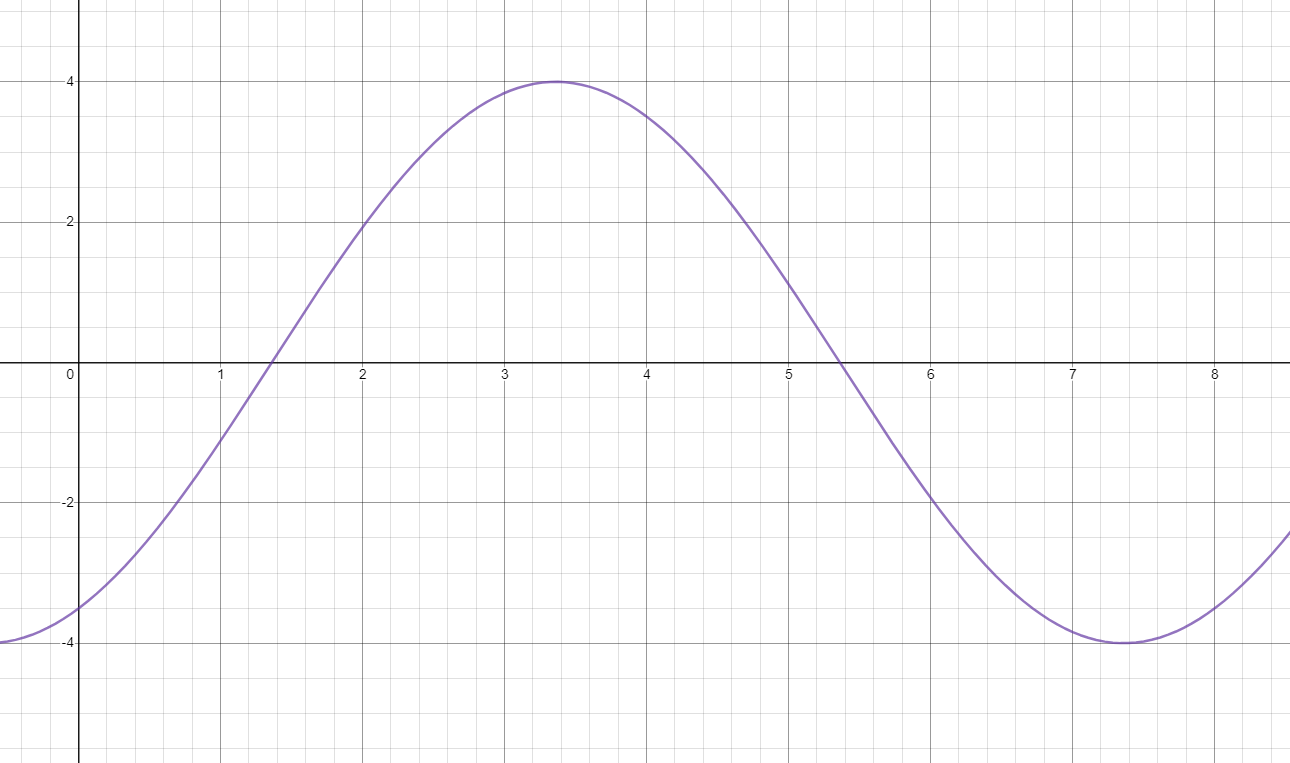
A waterwheel with a radius of 4 feet rotates such that half of it is above water and the other half is below the surface. The wheel makes one complete rotation every 8 seconds. The distance between a point on the outside of the wheel and the surface of the water at any point in time can be modeled by the function \( y = 4\sin\left( \frac{\pi}{4}\left( x - 1 \right) + 6 \right) \), where x is in seconds and y is in feet.
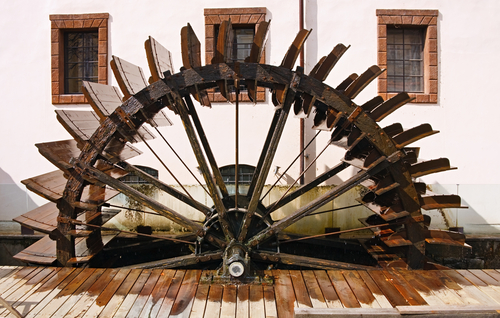
You can tell a lot about this situation from a visual representation of it—a graph. Because the graph is a plot of position versus time, you can see where that outside point would be with respect to the surface of the water over time. To graph the function, use a graphing utility such as a graphing calculator or DESMOS. Set the viewing window so that you see at least the interval \( 0 < x < 8 \) along the x-axis and at least the interval \( - 4 < y < 4 \) along the y-axis.
What does the graph of this function look like?
Now, use your graphing utility to graph each of the following functions that represent real-world situations. You will need to type the equation carefully to make sure it matches what’s given. You will also need to determine what the viewing window should be so that you can see the graph.
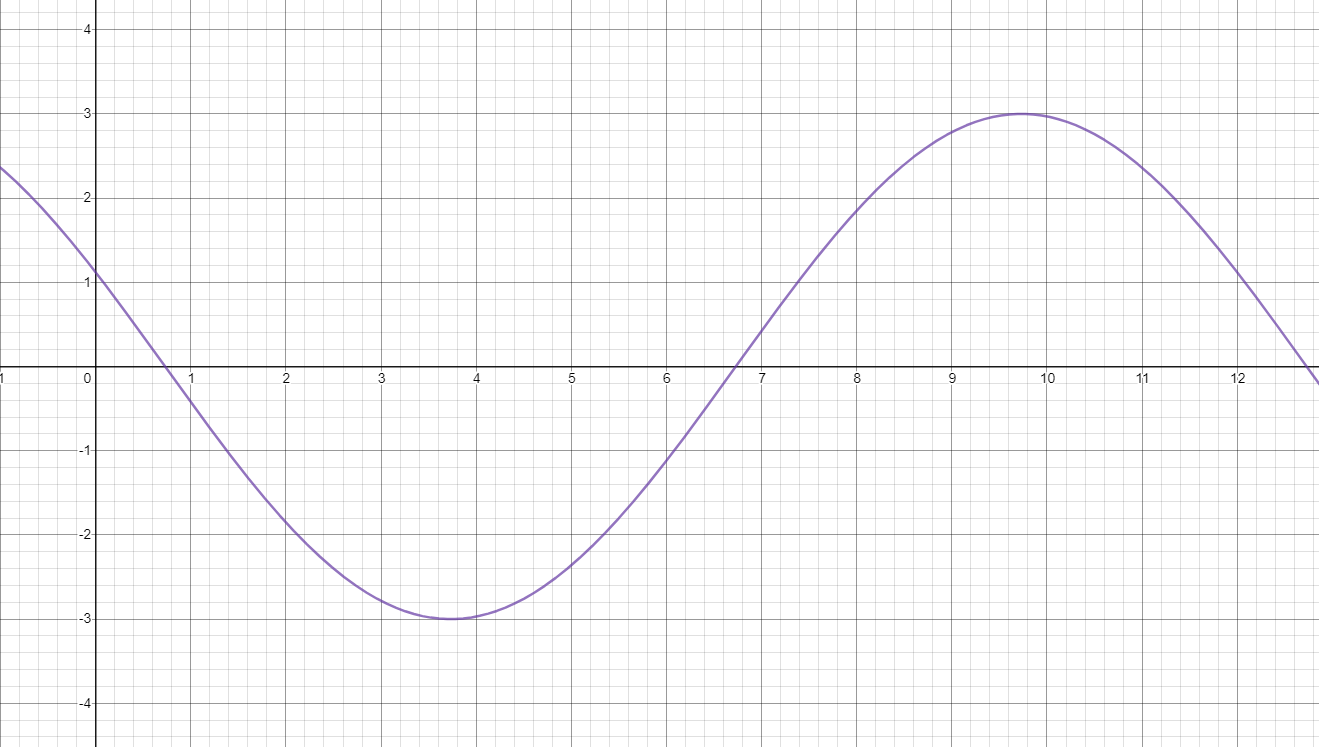
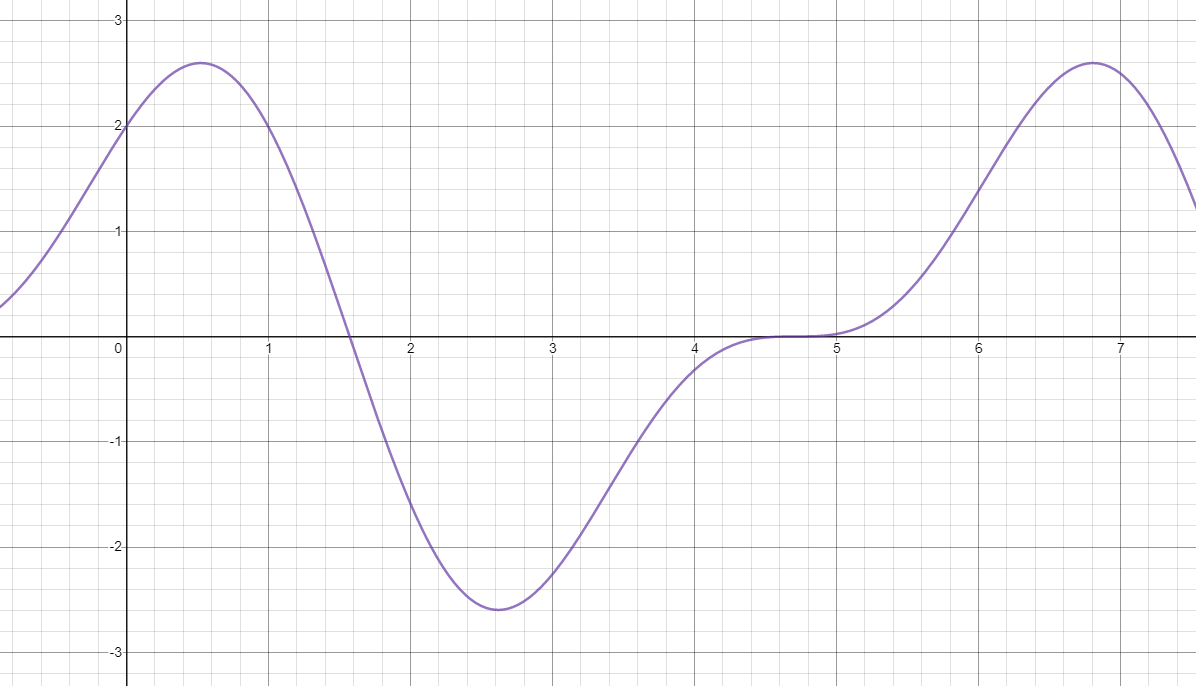
The position of a bob on a spring can be modeled by the function \( y = - 3\cos{\left( \frac{\pi}{6}\left( x + 2 \right) - 3 \right)} \), where x is in tenths of a second and y is the position in centimeters away from the rest position. It takes the bob approximately 12 tenths of a second (or 1.2 seconds) to complete one cycle (up and down).
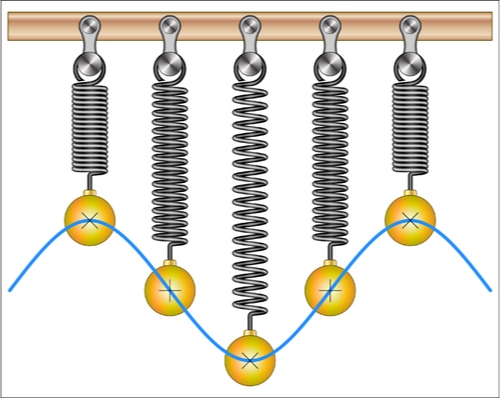
What does the graph look like for one complete cycle?
The graph should be shown from at least from -3 to 3 on the y-axis and from 0 to 12 on the x-axis. As long as that is covered, you have one complete cycle in your view.
The number of g-forces on a roller coaster can be modeled by the function \( y = 2\left( \cos x + \cos x\sin x \right) \), where x is in minutes and y is the number of g-forces. Graph the function for the complete 6-minute ride.

Since the ride is 6 minutes long, select a domain of at least 0 to 6, maybe a bit wider. Also, display the range from at least -3 to 3. Larger viewing windows just make the graph smaller, but they still work.
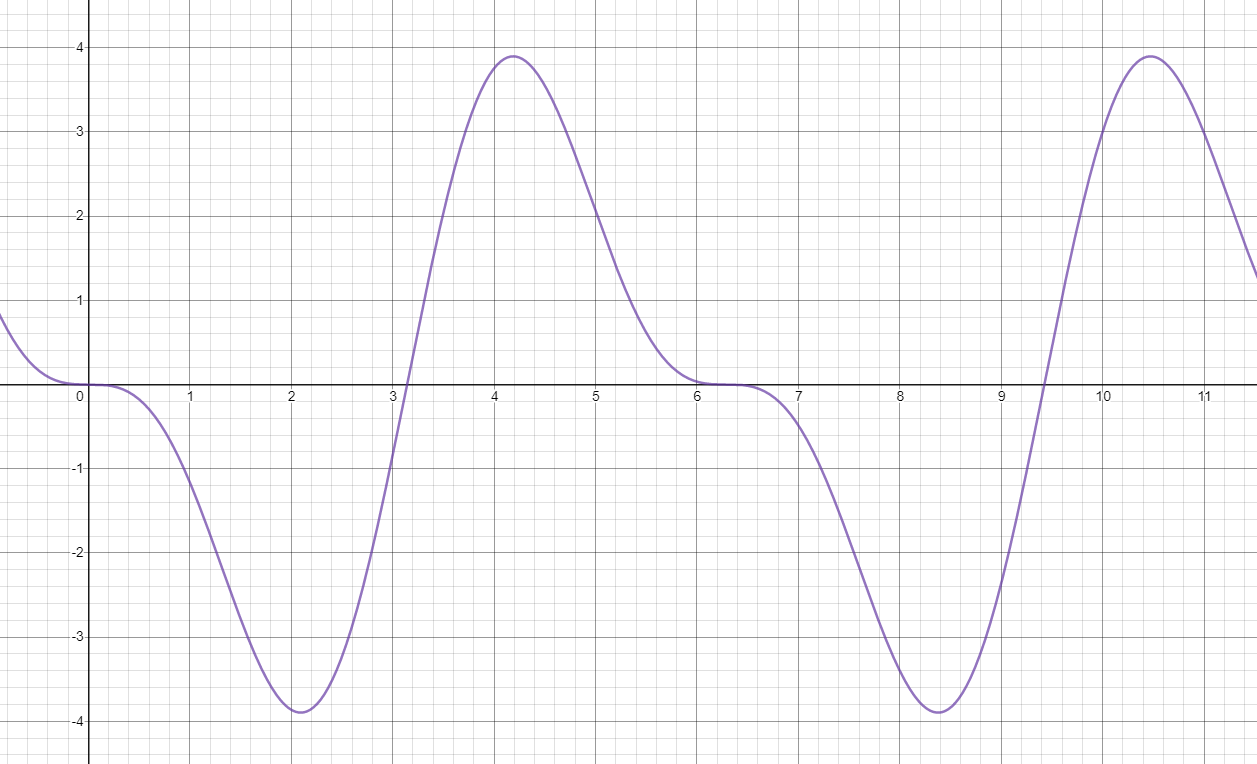
The amount of water (y) that is entering and exiting a swimming pool through the filtration system in gallons can modeled by the function \( y = - 3(\sin x - \cos x\sin x) \) after x minutes. What does the graph of this function look like for the first 10 minutes?

The x-axis should be shown from 0 to 10 minutes as required in the problem. The y-axis should be from at least -4 to 4.
Think You Got It?
Continue practicing graphing trigonometric functions on your graphing utility. Graph each of the equations below and click on it to see the graph to the equation on the interval \( 0 < x < 10 \).


