When a trigonometric function represents a real situation, values on the graph have a specific meaning based on the problem description. The minimum value is the lowest point on the graph, and the maximum value is the highest point on the graph. Both of these have meaning for the physical actions modeled by trigonometric functions. Let's look at the waterwheel situation again.
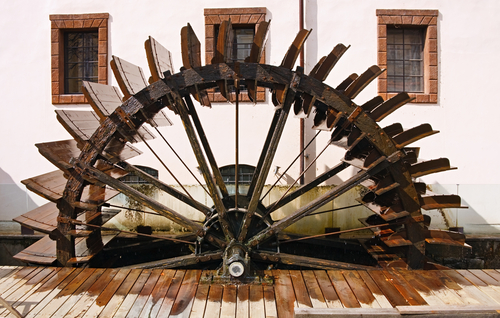
A waterwheel with a radius of 4 feet rotates such that half of it is above water and the other half is below the surface. The wheel makes one complete rotation every 8 seconds. The distance between a point on the outside of the wheel and the surface of the water at any point in time can be modeled by the function \( y = 4\sin\left( \frac{\pi}{4}\left( x - 1 \right) + 6 \right) \), where x is in seconds and y is in feet. When is the point on the wheel at its the highest point above the water? When is the point on the wheel as deep as it will get?
Using your graphing utility, graph the function again, but this time solve for the maximum and minimum points on the graph. You may need to review your utility's user guide to remember how to solve for the maximum and minimum points.
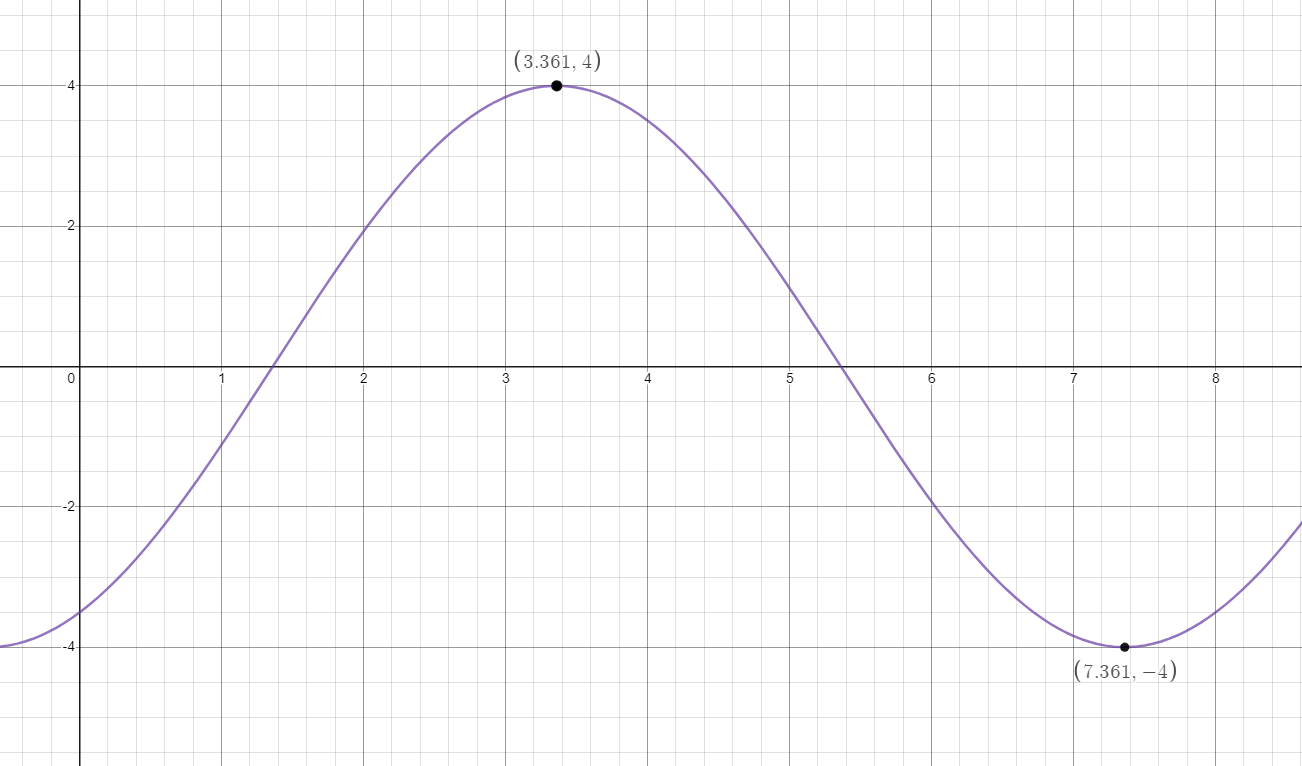
The maximum value is (3.361, 4), which means that the highest the point gets above the surface of the water is 4 feet (the radius of the wheel), which occurs at 3.361 seconds. The minimum value is (7.361, -4), which means that the lowest the point gets below the surface of the water is 4 feet (thus it is negative), which occurs at 7.361 seconds into the rotation.
Give It a Shot!
Now, find the minimum and maximum values of each of these functions and describe what they mean given the situation.
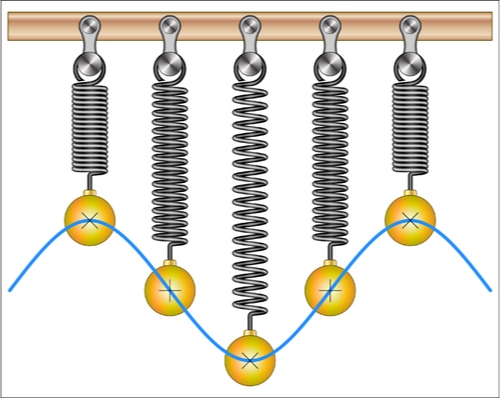
The position of a bob on a spring can be modeled by the function \( y = - 3\cos{\left( \frac{\pi}{6}\left( x + 2 \right) - 3 \right)} \), where x is in tenths of a second and y is the position in centimeters away from the rest position. It takes the bob approximately 12 tenths of a second (or 1.2 seconds) to complete one cycle (up and down).
What are the maximum and minimum of the graph, and what do they mean?
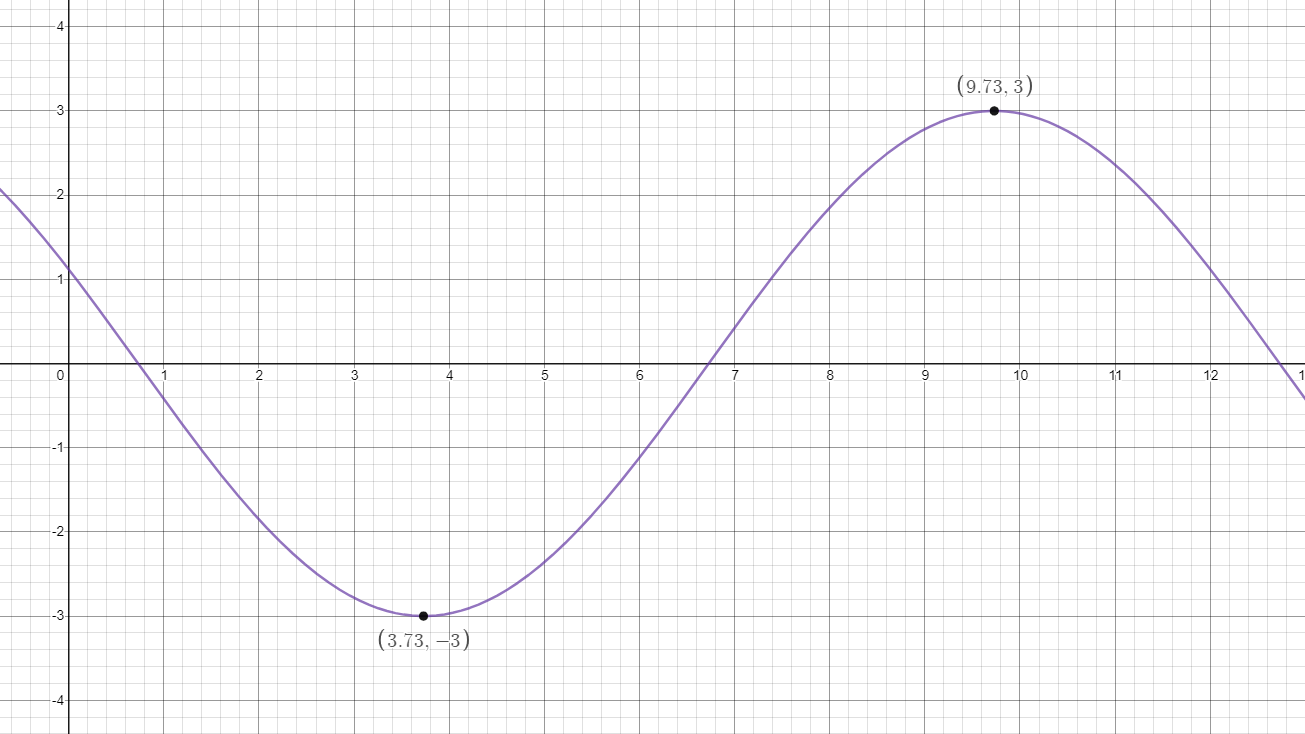
The minimum value is (3.73, -3), which means that after 3.73 tenths of a second (or 0.373 seconds), the pendulum bob is at its lowest point—3 centimeters below the rest position. The maximum value is (9.73,3), which means that after 9.73 tenths of a second (or 0.973 seconds), the bob is at its highest point—3 centimeters above the rest position.
The number of g-forces on a roller coaster can be modeled by the function \( y = 2\left( \cos x + \cos x\sin x \right) \), where x is in minutes and y is the number of g-forces.
What are the maximum and minimum of the graph, and what do they mean?

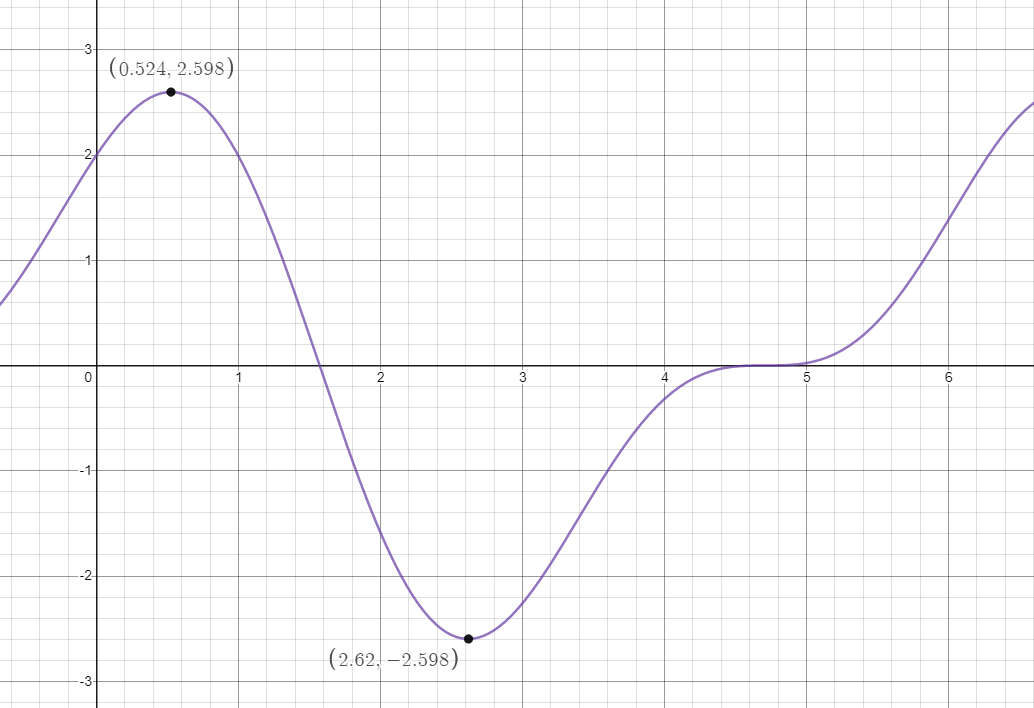
The maximum value is (0.524, 2.598), which means that the rider will feel 2.598 g-forces at 0.524 minutes. The minimum value is (2.62, -2.598), which means that the rider will feel -2.598 g-forces at 2.62 minutes.
The amount of water (y) that is entering and exiting a swimming pool through its filtration system in gallons can modeled by the function \( y = - 3(\sin x - \cos x\sin x) \) after x minutes.
What are the maximum and minimum of the graph (in the first 10 minutes), and what do they mean?

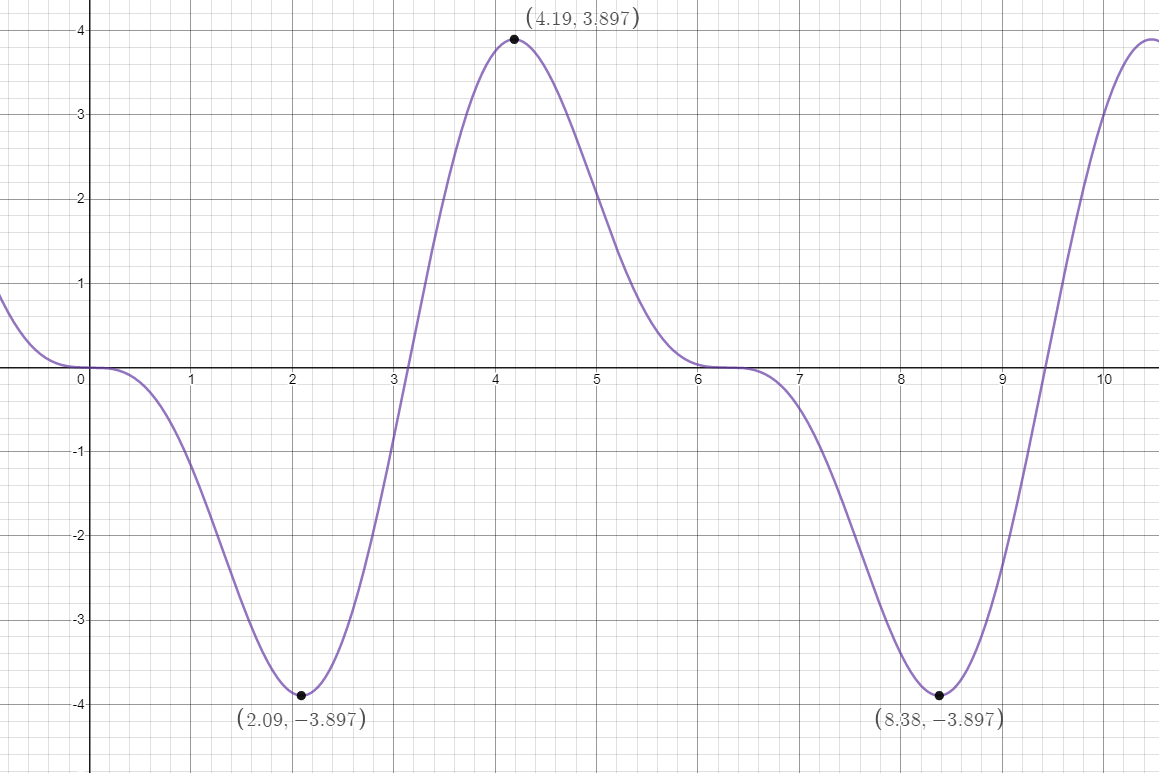
There are actually two minima in this case: (2.09, -3.897) and (8.38, -3.897). That means that the pool loses 3.897 gallons of water after 2.09 minutes and again after 8.38 minutes.
The maximum is at (4.19, 3.897), which means that the pool gains 3.897 gallons of water after 4.19 minutes.
