Loading...

How do you model with polynomials?

You have learned a lot about polynomials. You know how to find their roots and their y-intercept. You can describe their end behavior and their concavity, and you can state the number of points of inflection of a given polynomial equation. You can also sketch the graph of a polynomial or use a graphing utility to create an exact curve. Finally, you have learned about the relative and absolute extrema of polynomial functions. But what can you do with all this information?

You can use your polynomial knowledge to create models to solve problems both inside and outside the mathematics classroom. It is important to remember that a model is just a representation of a situation using mathematical language. Here, you will be creating a polynomial function to represent some data.

A herd of elk are introduced into the ecosystem of a small island. The number of elk on the island was then recorded each year for five years. The data are shown in this table.
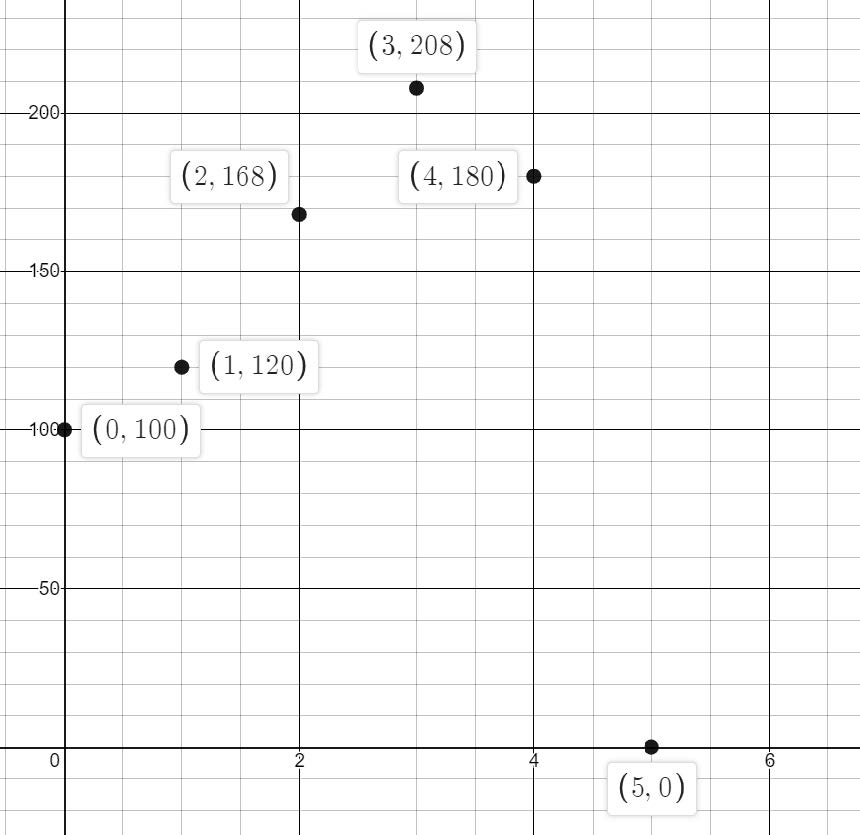
elk in the wild
Year 0 1 2 3 4 5
Population 100 120 168 208 180 0

Create a polynomial equation to model this situation.

Read through the tabs below to learn how to use your knowledge of polynomial equations to model what happened to the elk population on the island.

Create a graph of your known data.

Plot the year as the independent variable and the number of elk on the island as the dependent variable.

Examine the graph. The number of elk increased, reached a maximum number, and then began to decrease.

It appears that a polynomial equation of some kind may be able to be used to fit this data.

graph

The graph of the data indicates that you might be able to use a polynomial equation. But what degree equation should you use?

One way to determine the polynomial's degree is the finite differences method.

If a polynomial function has a degree of n, then the nth-order differences of that function will be nonzero and constant. This is a very mathematical way of saying that you need to find the values of
f(1) - f(0)
f(2) - f(1),
f(3) - f(1), and so on.

These differences are called the 1st order differences.

You can then use the first order differences to find the 2nd order differences.

Then you can use the 2nd order differences to find the 3rd order differences.

You continue this pattern until all your differences are the same non-zero constant.

Find the finite differences of the elk data.

You should note that in most cases, the polynomial model will not fit the data exactly. In these cases, the finite differences will be close to the same number but not exact.

graph

Question

What is the degree of the polynomial function that will model the elk data?

You may recall from previous math classes that you can use technology to calculate a line of best fit. This is a line (or curve) that passes through or close to many of the points on a graph.

Sometimes the line of best fit will pass through all the points on the graph. When this happens, there are no residuals. Other times the line will not pass through all the points. In these cases, there are residuals.

two puzzle pieces connecting

Reminder

A residual measures how well the line of best fit matches the data. When you use technology to create a line of best fit, you will be shown the r-value. A regression with an r = 1 is the ideal model—it is a perfect fit. A regression with an r-value of less than one means the data don't fit perfectly.

Look at the graph of the elk data, repeated here.

From your finite difference analysis, you know that you will need a 4th degree polynomial to model this data.

You can use technology, such as your graphing calculator, to find 4th-degree regression using the data (you may need to do some research on how this is done on your particular device). The fourth-degree regression gives you an r = 1, which means the residuals are all zero.

graph

Once you have a regression equation, you can replace the y and the x with population number (N) and time in years (t), so that your model is descriptive of the data.

The number of elk, N(t), after t years is described by the polynomial function

\( N(t) = -t^4 + 21t^2 + 100 \)

This graph represents the elk data with the curve laid over the top.

You will now be able to use this polynomial function as a model to explore the elk population.

For a situation like population, you need to consider the domain and range that makes sense for the model.

You cannot have a negative number of elk nor a negative number of years, so you can use this model only for positive values.

graph

You can use this polynomial function and solve for the x- and y-intercepts as well as the maximum value to find the answers to questions pertaining to the original situation.

Study the graph and use it to answer the questions below. Click the question to check your answer.

graph
Question Solve for… Answer

Question

Can any degree polynomial be a model?

Question

Are there limits to the algebraic models that are created to represent real-life situations?