Step One: Gather Data
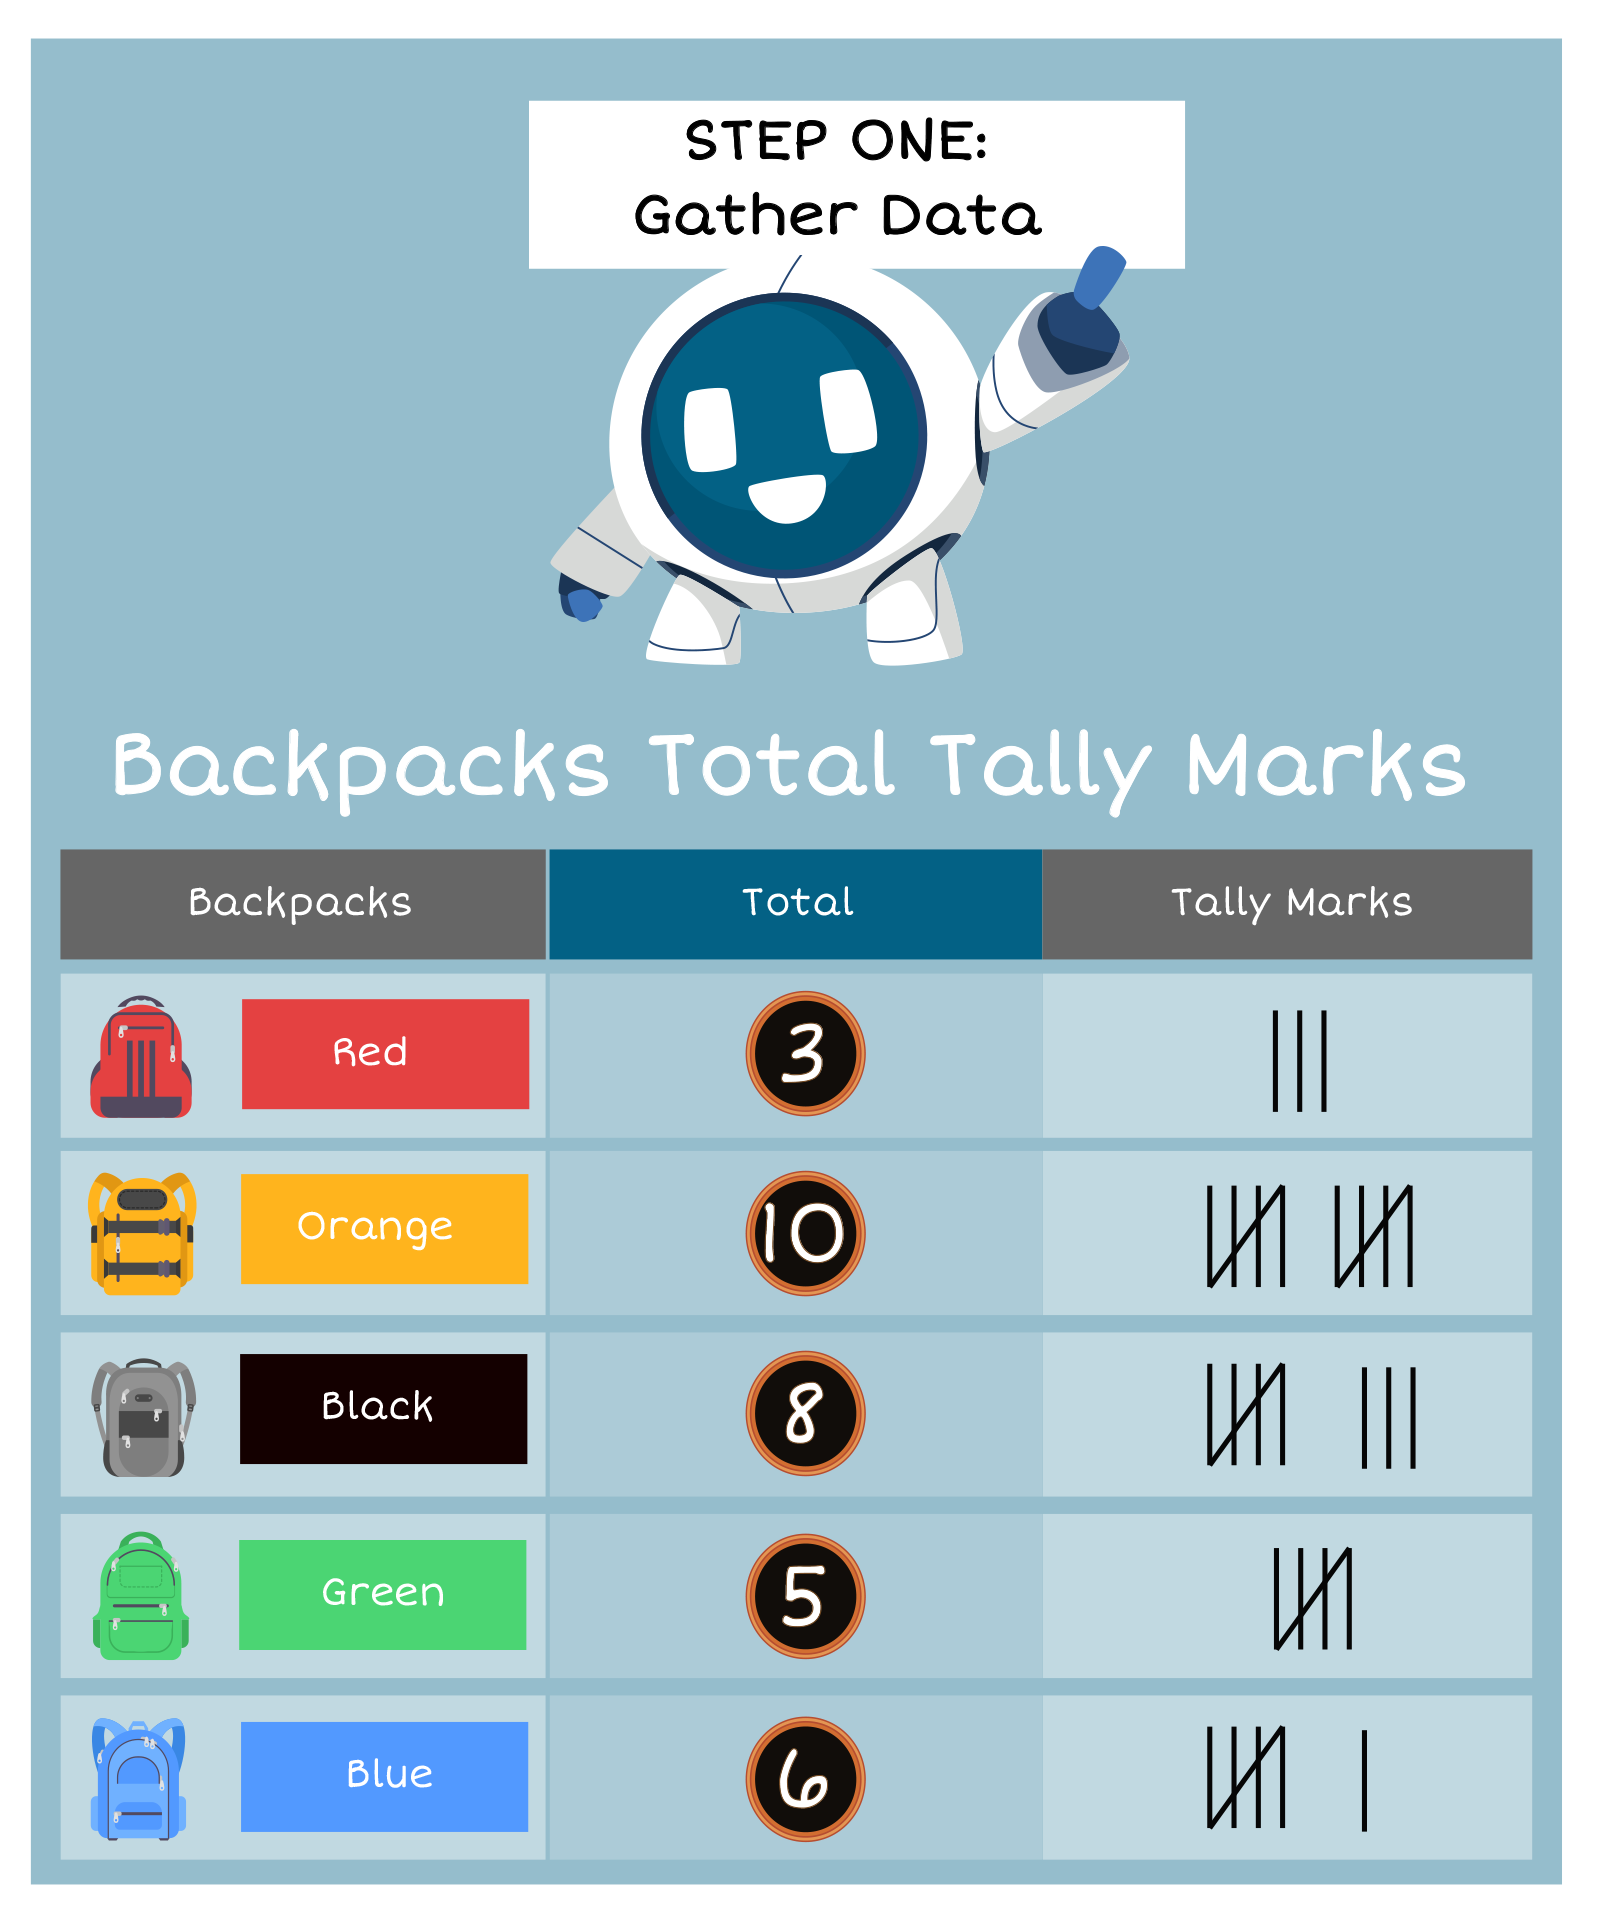
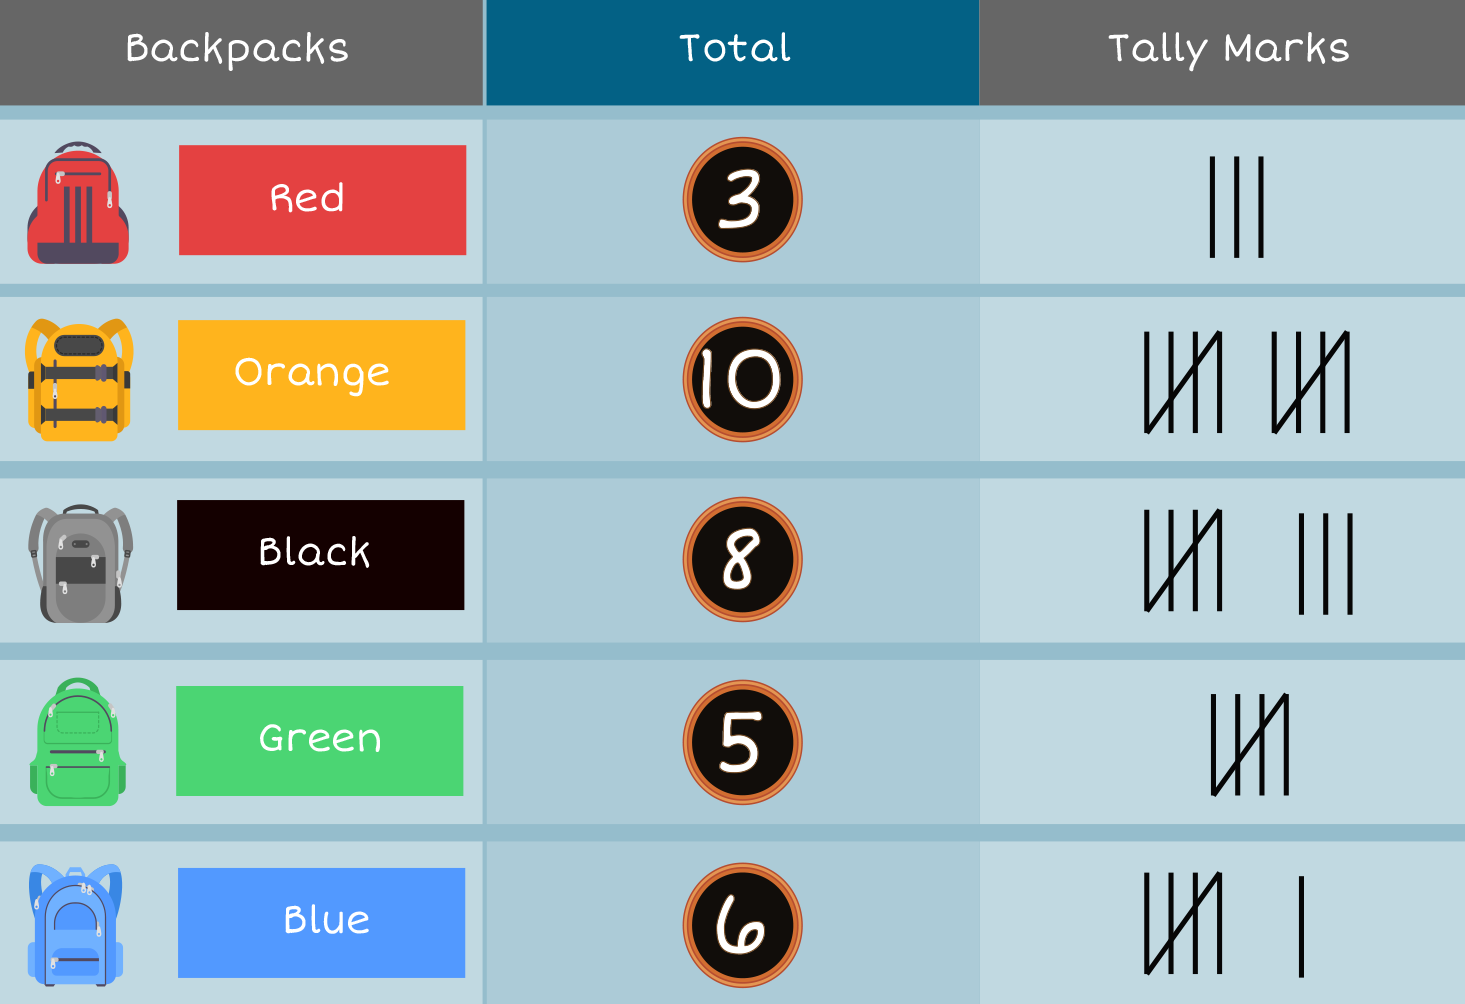
Dot’s first step is to gather data. Dot finds the totals of all the different colors of backpacks., Here is the data she collected.
Now that Dot has collected all the data, let’s look at step two.
Goal:
Goal:

Goal: Gather data to make a bar graph.
In this lesson, we will learn all about bar graphs. Bar graphs show data as colored bars on a graph. Remember, we have learned about tally marks and graphs. Now, we will put data in a bar graph and then analyze the data.
Dot the Robot is at school today. She is keeping track of students and the special things they have and do at school. Our students have jackets, backpacks, activities, and lunches. Let’s gather information with Dot to see what our students like to bring to school.
Dot is looking at all the different colors of backpacks the students are wearing. This is the data she will be collecting. Let’s follow her steps to help us make a bar graph.
Dot’s first step is to gather data. Dot finds the totals of all the different colors of backpacks., Here is the data she collected.
Now that Dot has collected all the data, let’s look at step two.
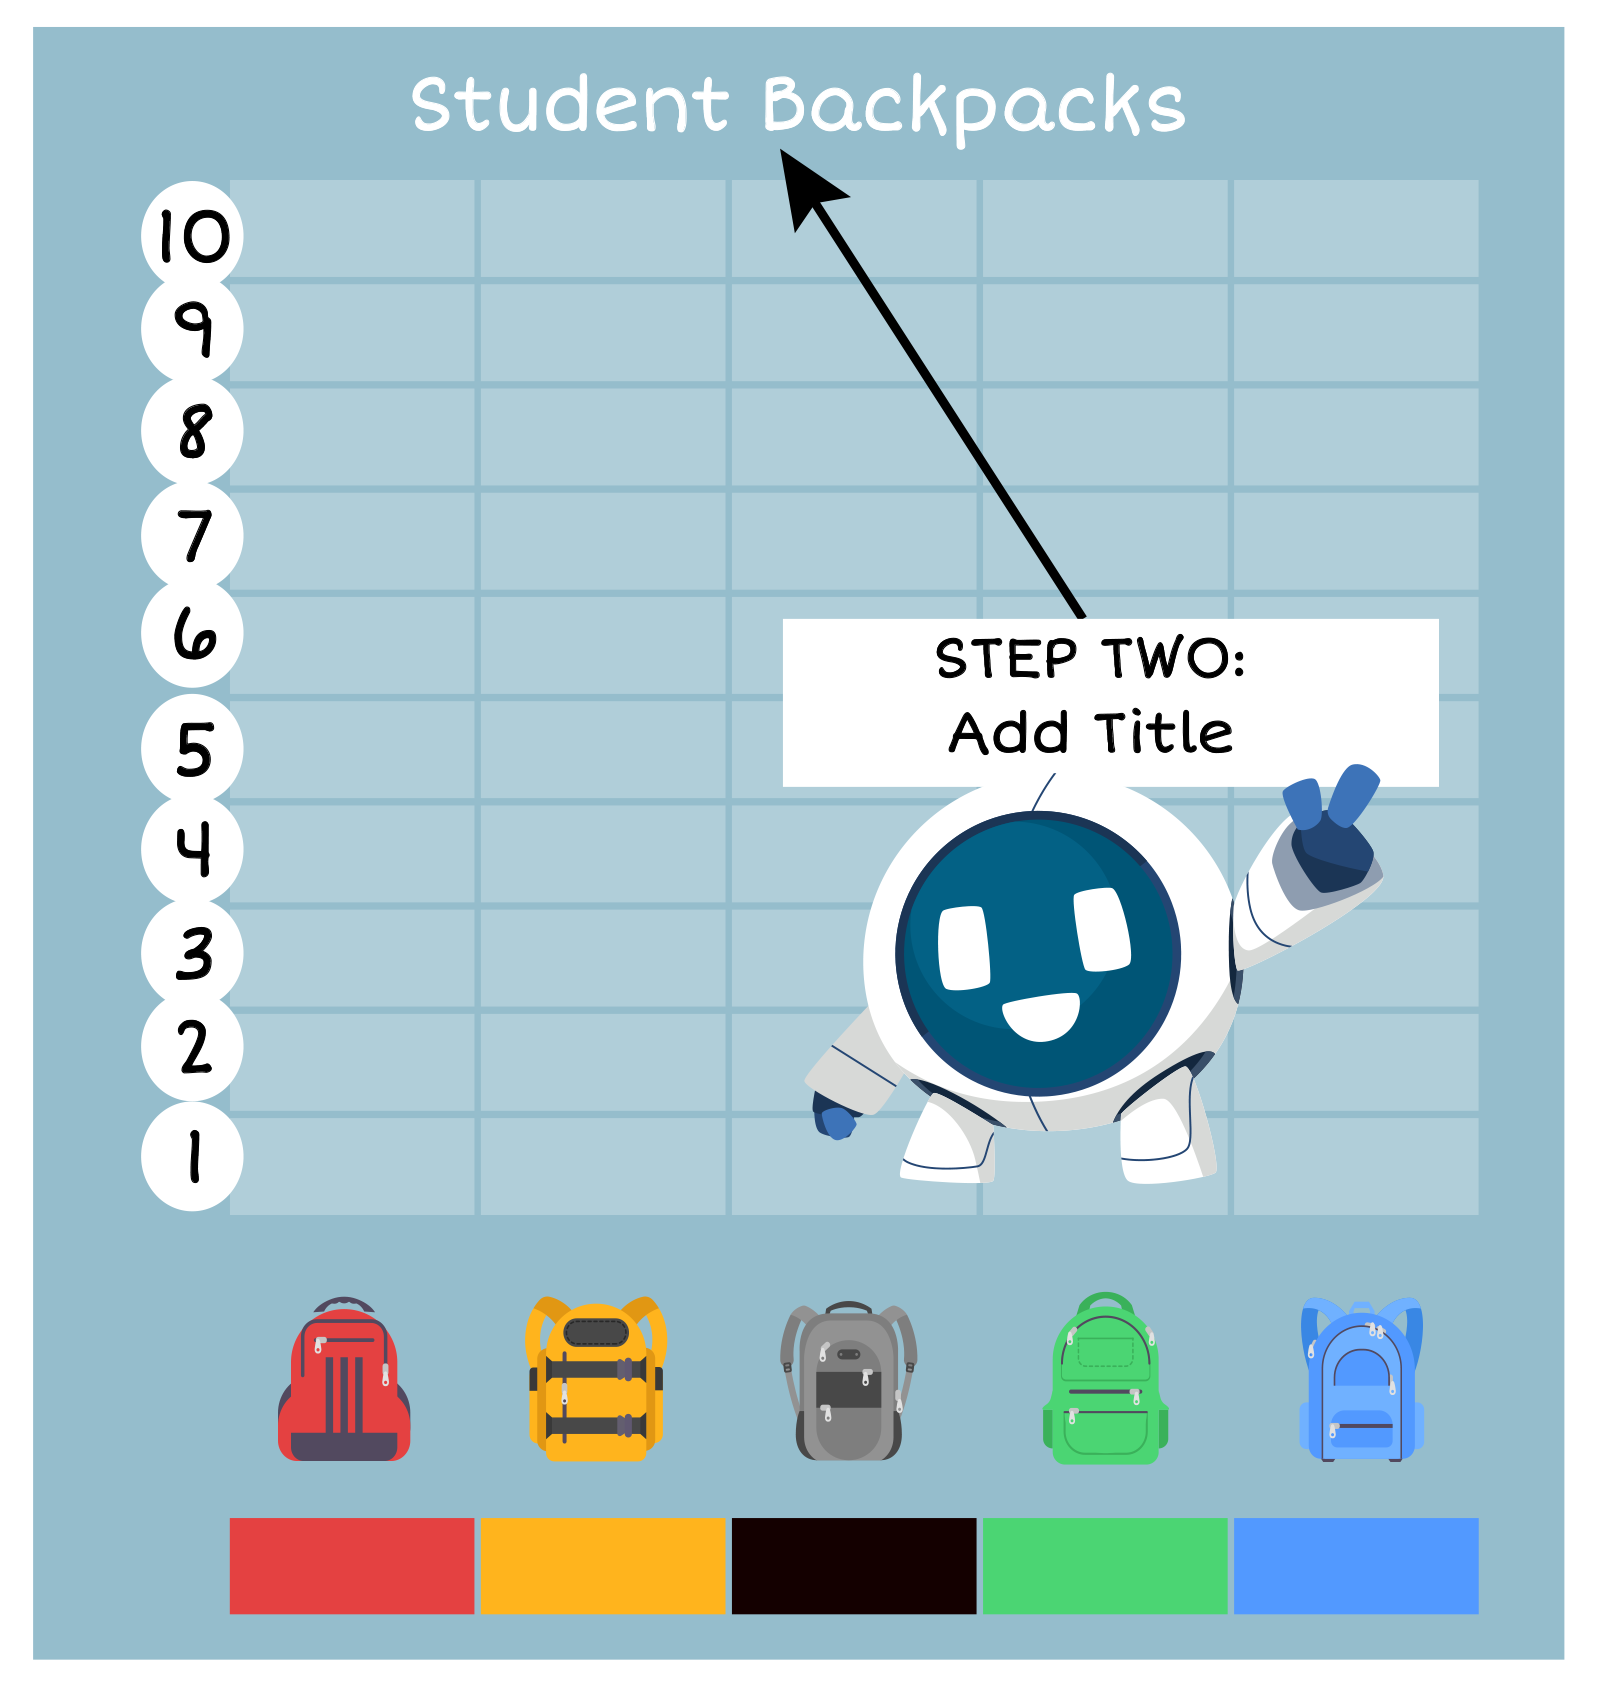
Dot the Robot wants us to know about titles. We have to title our graph so that we understand what the data is about. She labels the graph "Student Backpacks" since that is the data we are collecting.
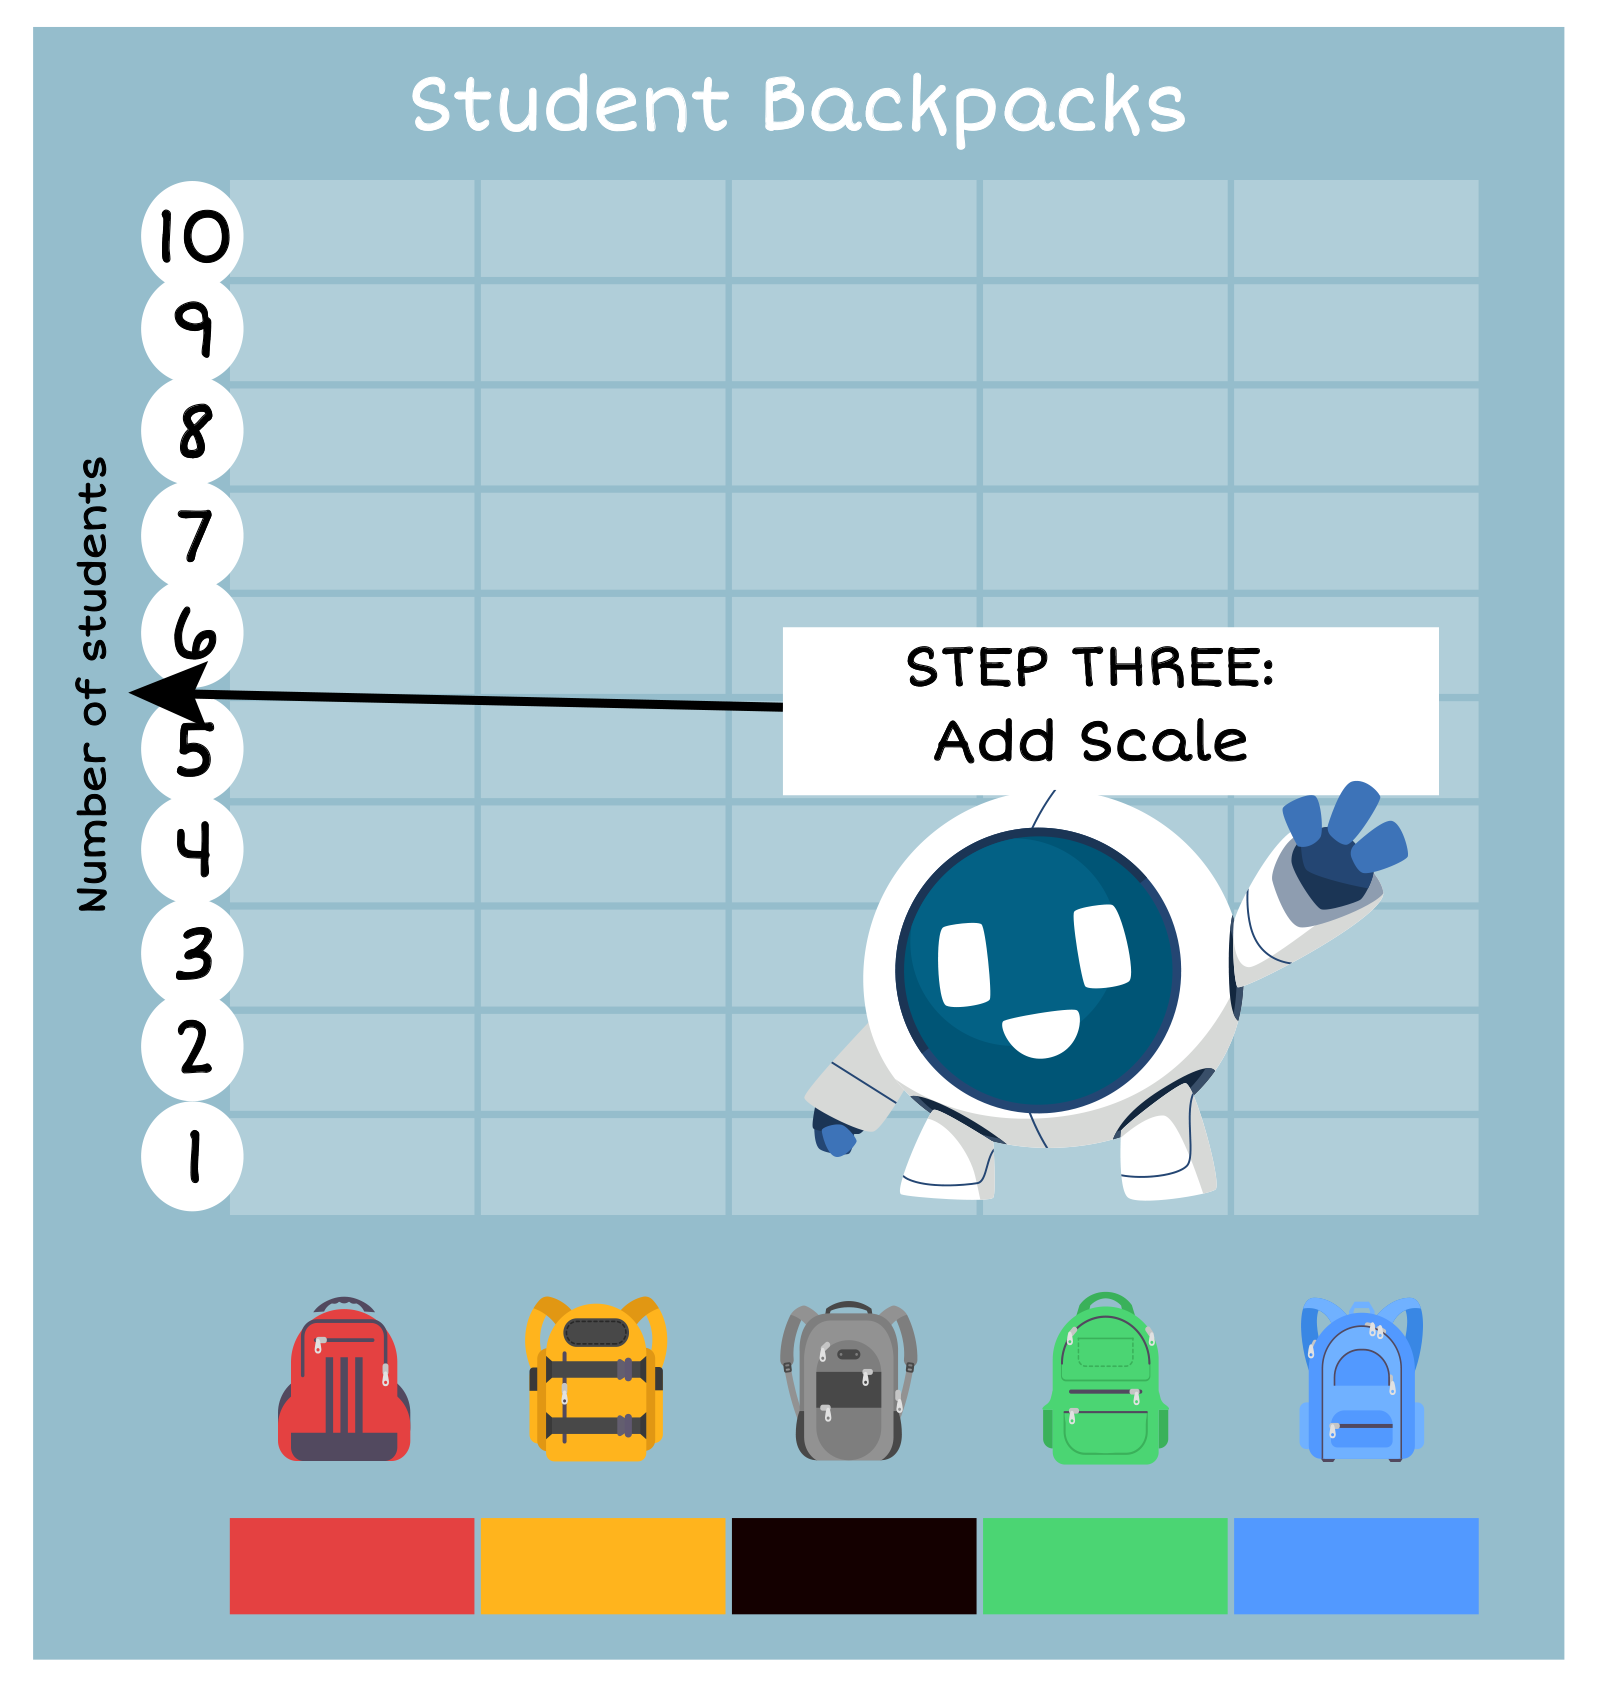
Next, we must add a scale to show how many backpacks are being counted.
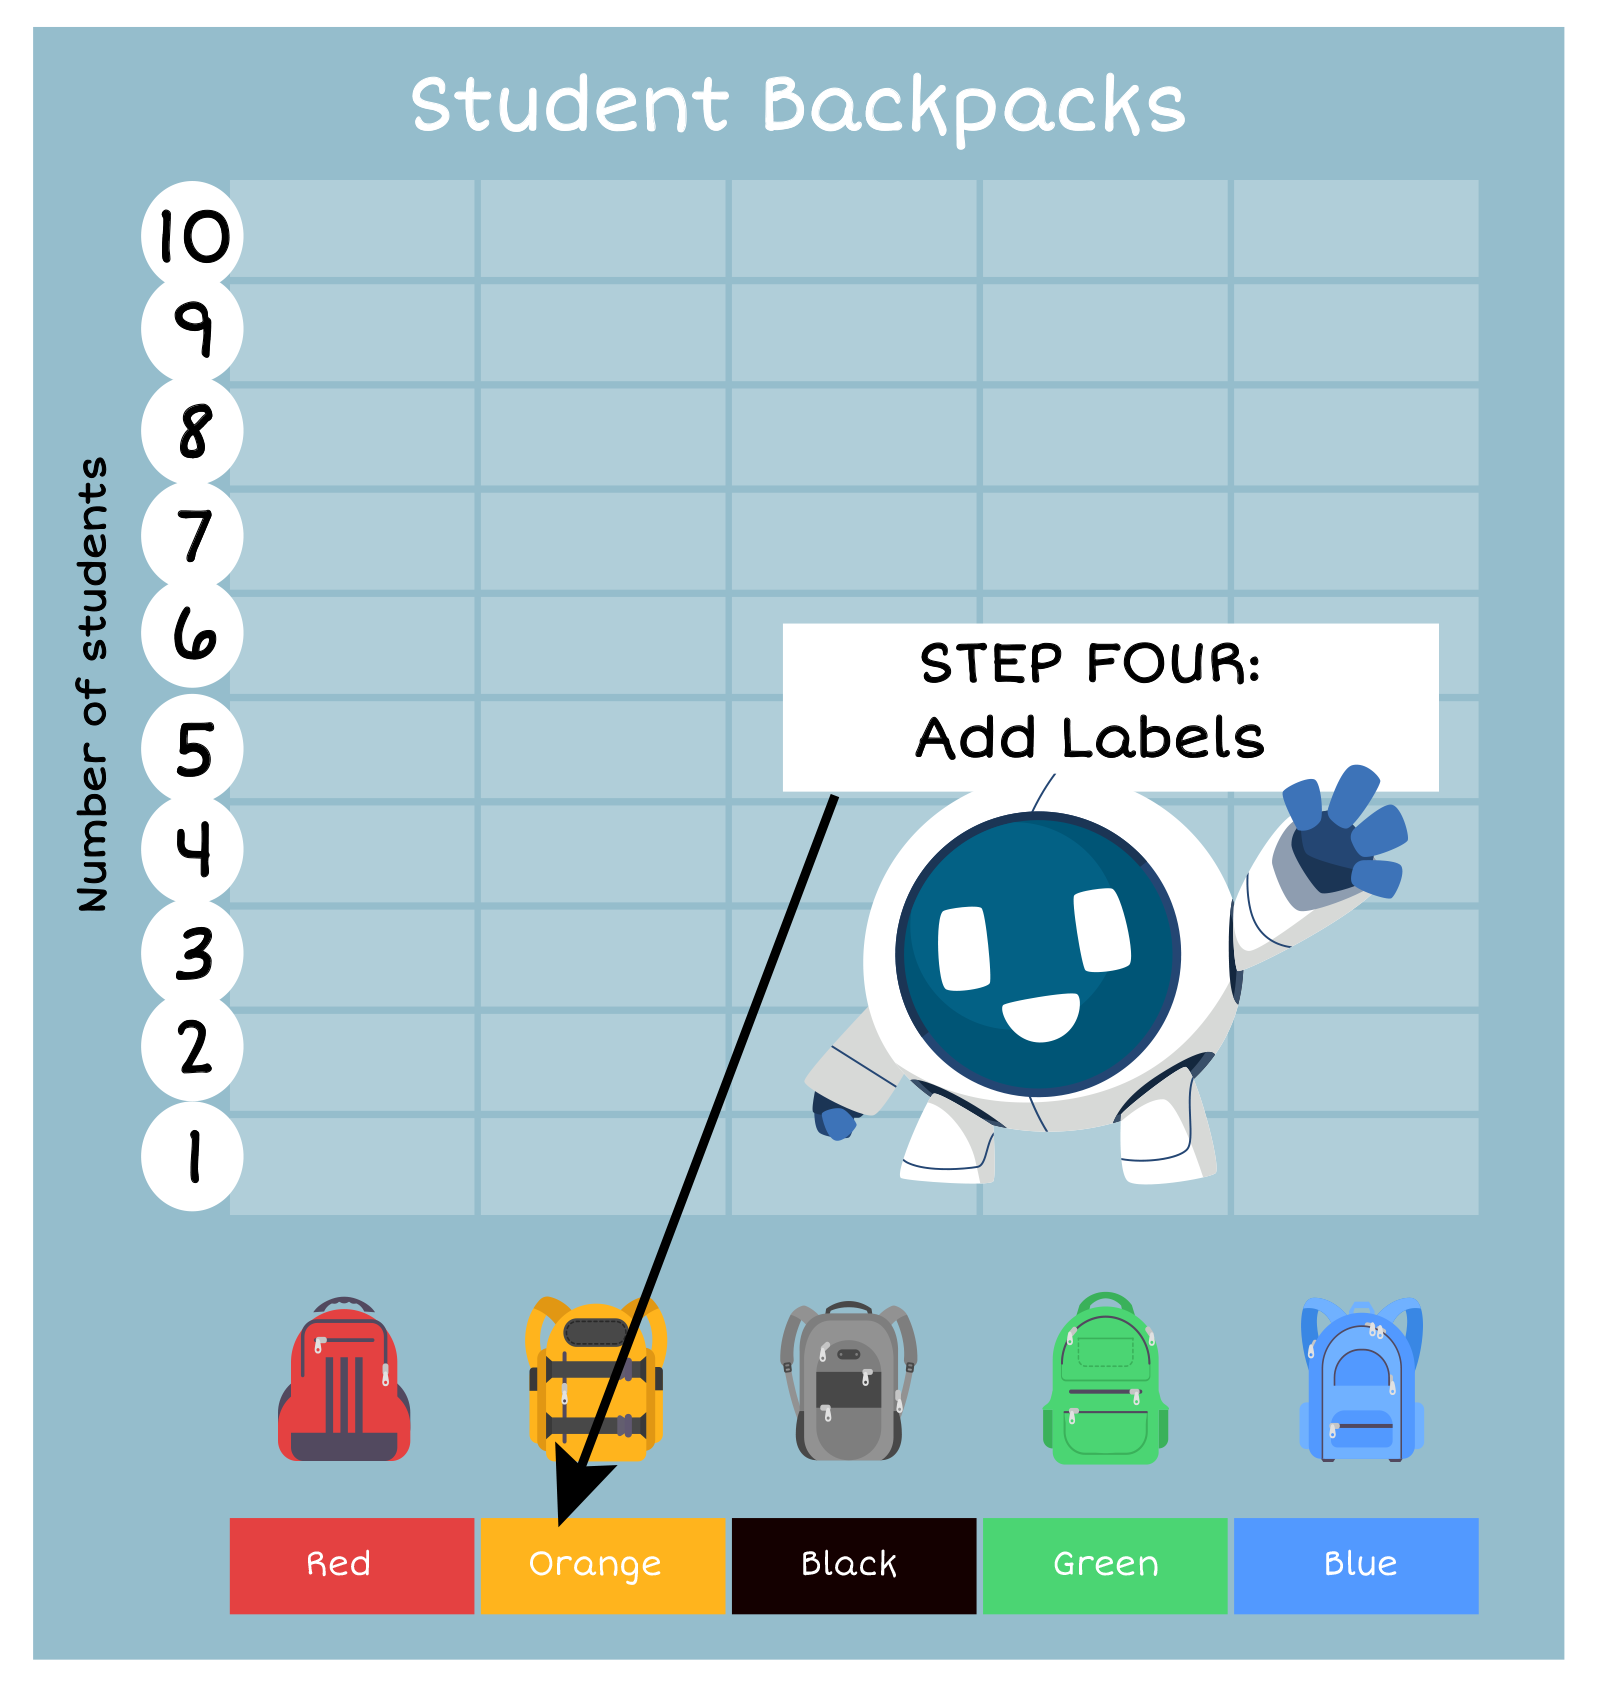
In step four, we add labels to show what data we collected.
Our final step is to graph the data.
In our bar graph, the colors of the backpacks create the bars. We can look at the data Dot collected using a tally chart to enter the data in our bar graph.
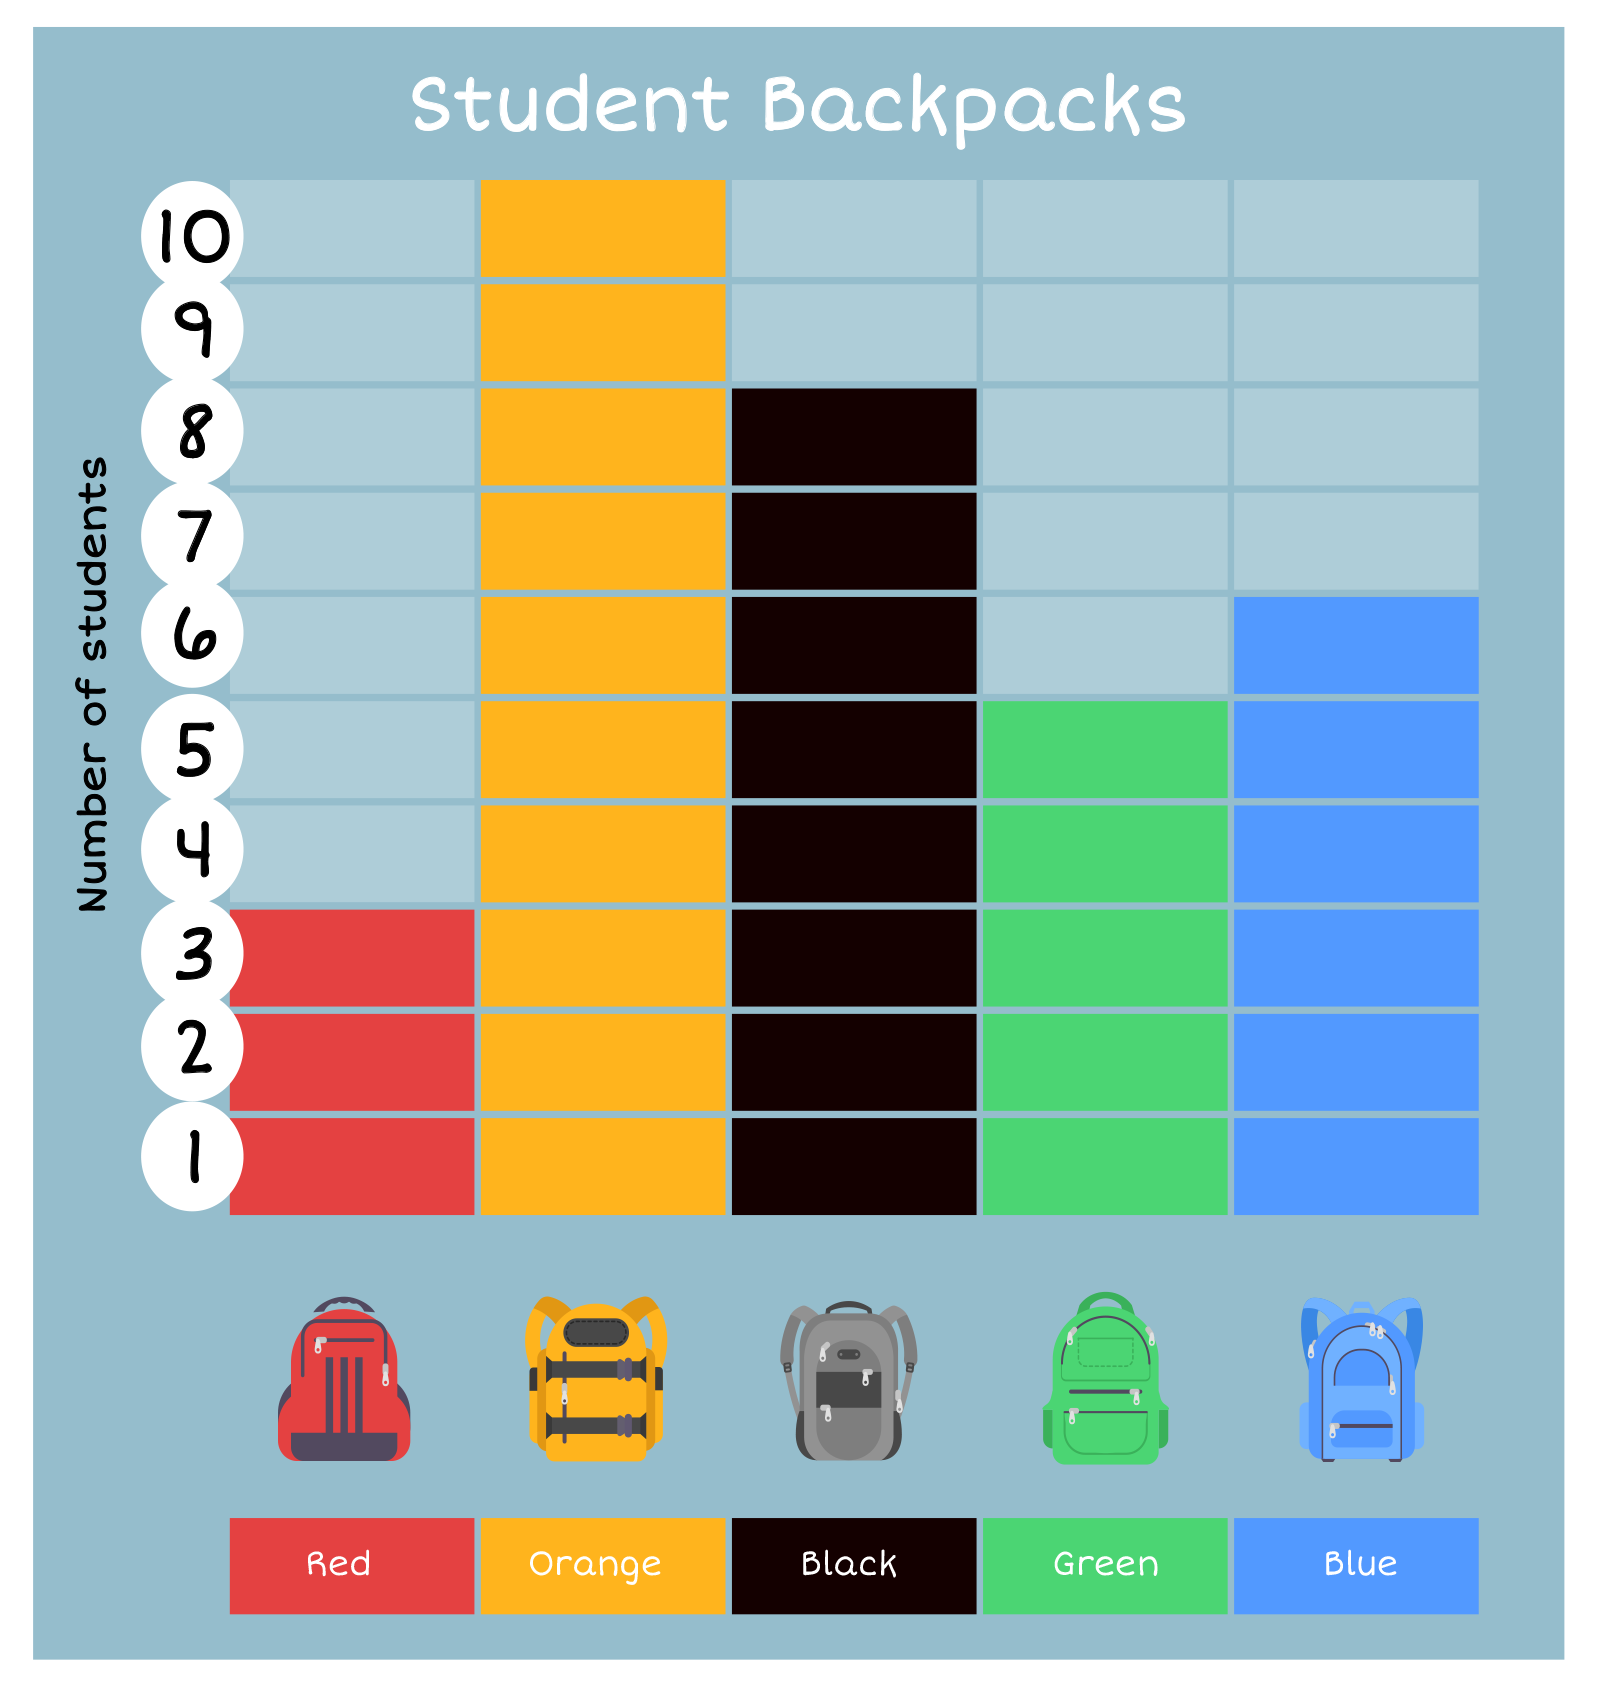
You did a great job helping Dot the Robot create our bar graph! Let’s analyze the data and see what backpack colors the students are wearing.
What color backpack are the most students wearing?
What color backpack are the fewest students wearing?
How many more students have blue backpacks than have green backpacks?