It’s Your Turn!
Practice analyzing bar graphs.
Goal:
Goal:

Practice!
Goal: Practice using bar graphs and analyzing data.
Let’s create a bar graph and analyze the data!
Look at the data below. For each playground activity shown, mark that column, by clicking on the black space above the activity, on the table. Start at the bottom of the graph, and work your way up. Once you have completed your table, answer the question that follows.
| Activity | Total | Tally Marks |
|---|---|---|
| Played on the merry-go-round | 1 | | |
| Played in the sandbox | 3 | ||| |
| Played hopscotch | 4 | |||| |
| Played on the monkey bars | 2 | || |
| Favorite Playground Activities | |||
|---|---|---|---|
|
|
|
|
|
|
|
|
|
|
|
|
|
|
|
|
|
|
|
|
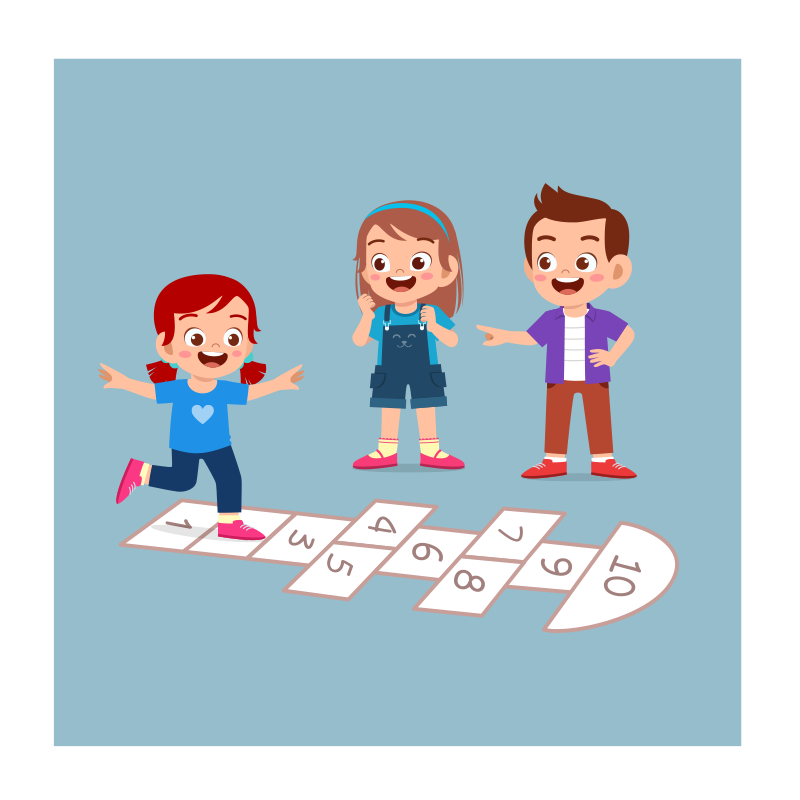 Hopscotch |
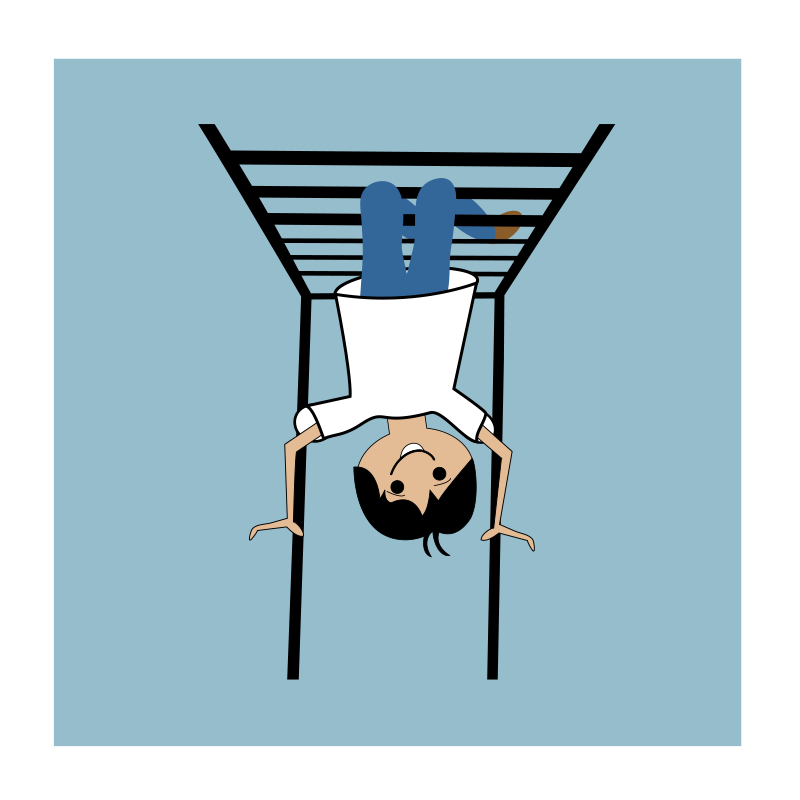 Monkey bars |
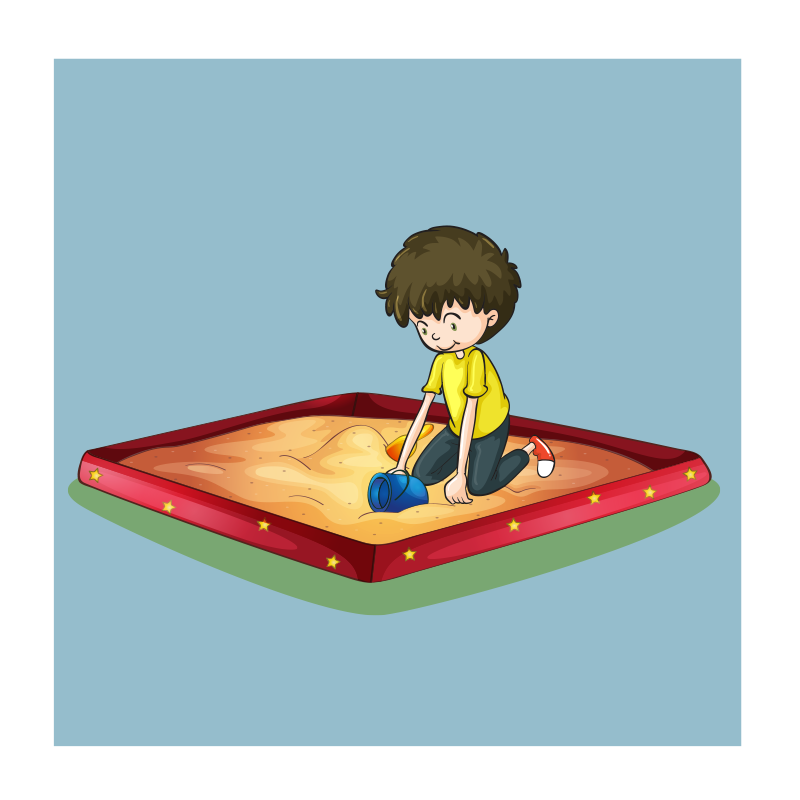 Sandbox |
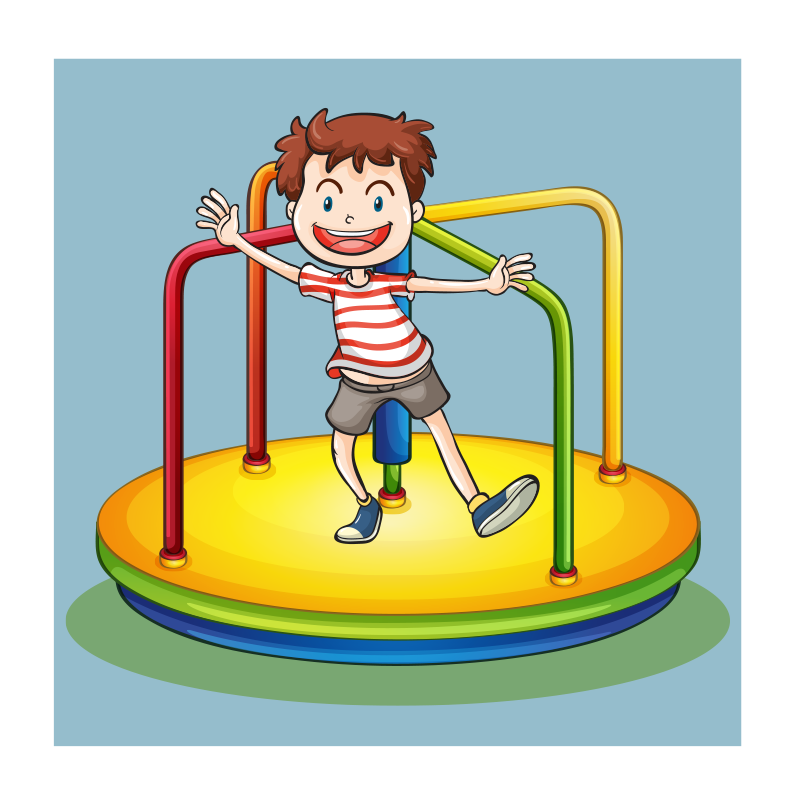 Merry-go-round |
What activity do you see the most students playing at recess?
Correct! Hopscotch!