Make a Pictograph
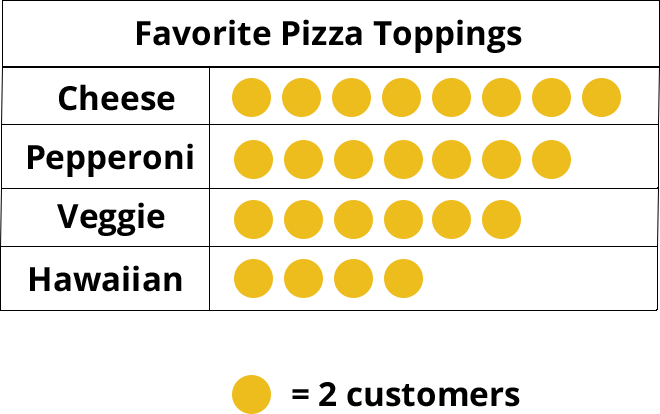
Here is Sofia’s pictograph! Pictographs are graphs that use pictures to show data. Let’s help her put data in the pictograph.

Goal:
Goal:

Goal: Collect data and create graphs.
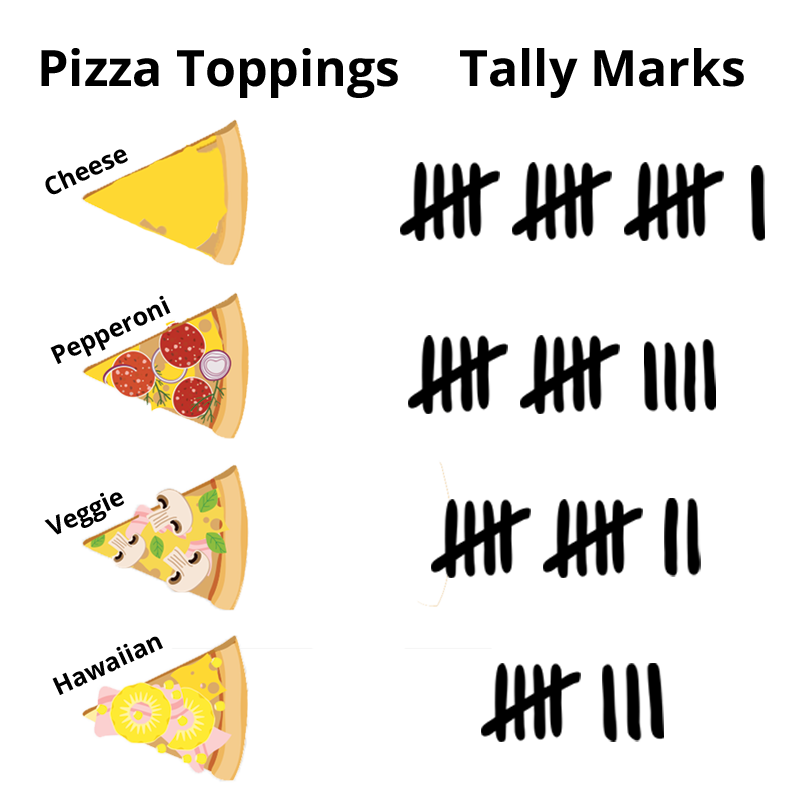
Sofia’s data shows four different kinds of pizza.
Here is Sofia’s pictograph! Pictographs are graphs that use pictures to show data. Let’s help her put data in the pictograph.
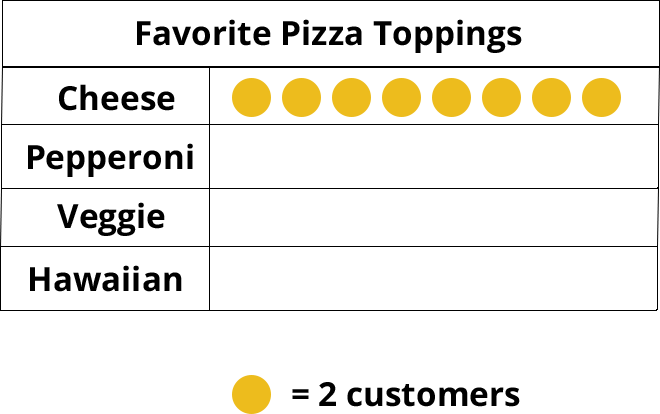
The tally chart says that 16 customers like cheese on their pizza. Each yellow dot in the pictograph represents 2 customers, so we will put 8 dots in the Cheese row.
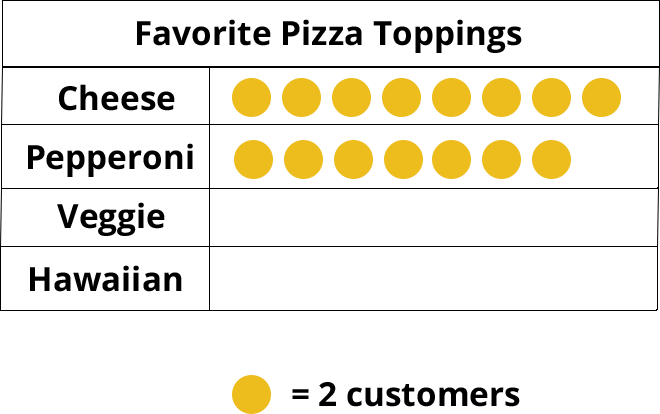
14 customers like pepperoni on their pizza. Let’s put 7 dots in the Pepperoni row.
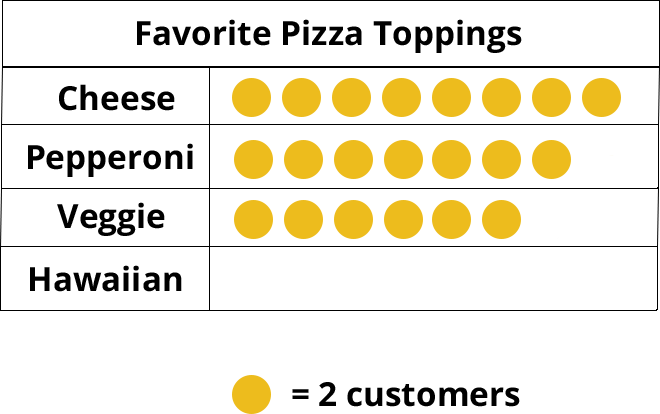
6 dots go in the Veggie row because 12 customers like veggies on their pizza.
Only 8 customers like Hawaiian toppings on their pizza, so let’s put 4 dots in the Hawaiian row.

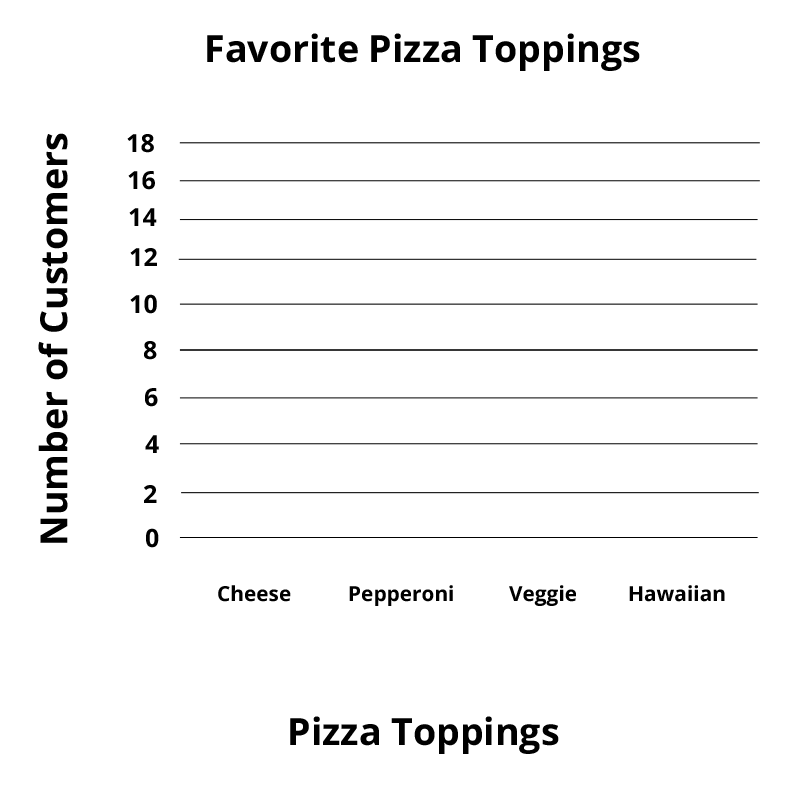
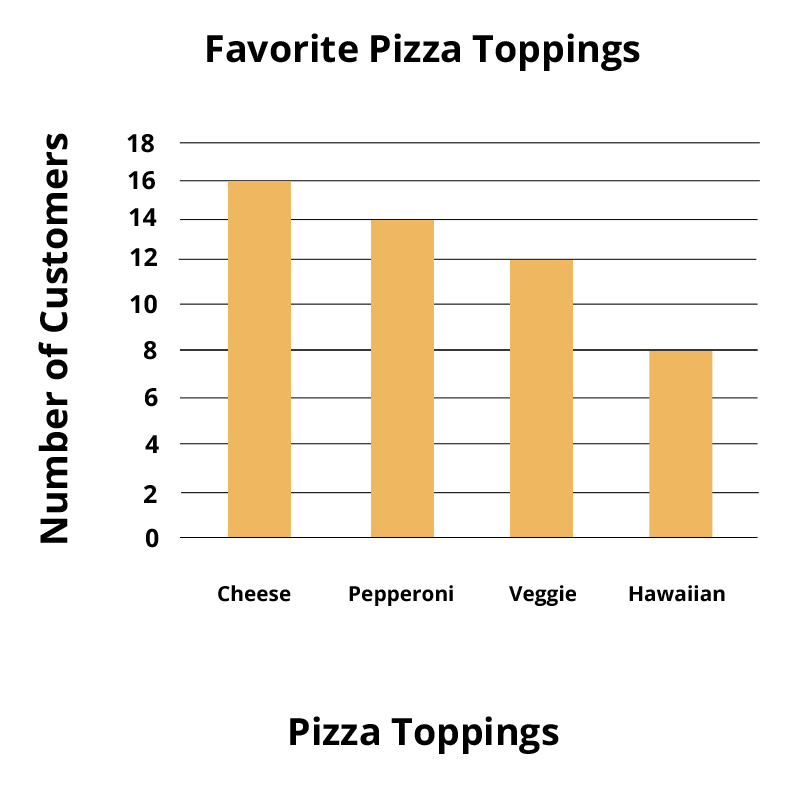
We can also use Sofia’s tally chart to make a bar graph! Bar graphs are graphs that use bars to show data.
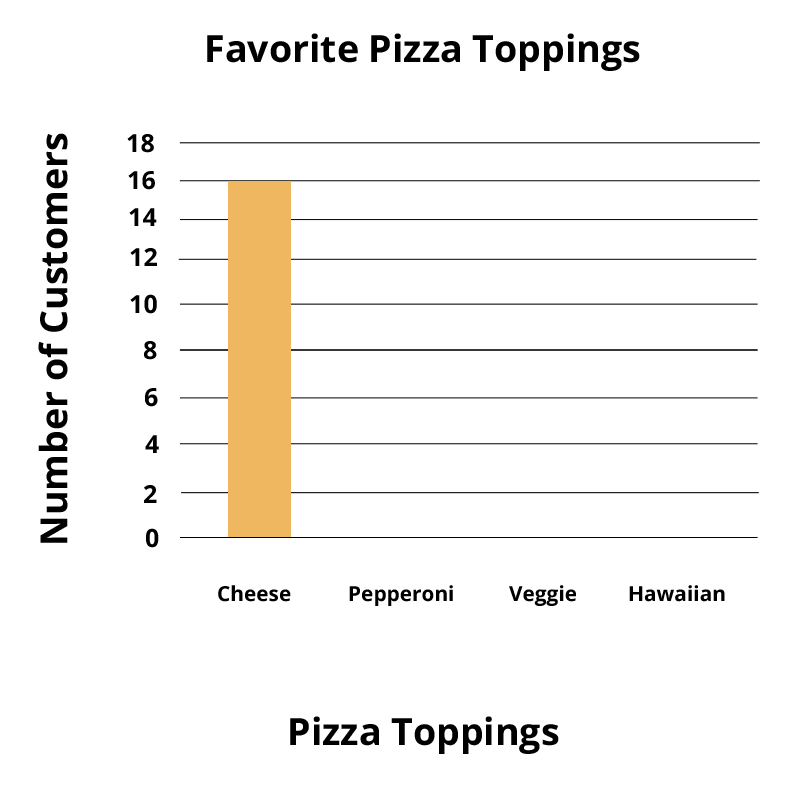
16 customers like cheese on their pizza, so the bar above Cheese will line up with 16.
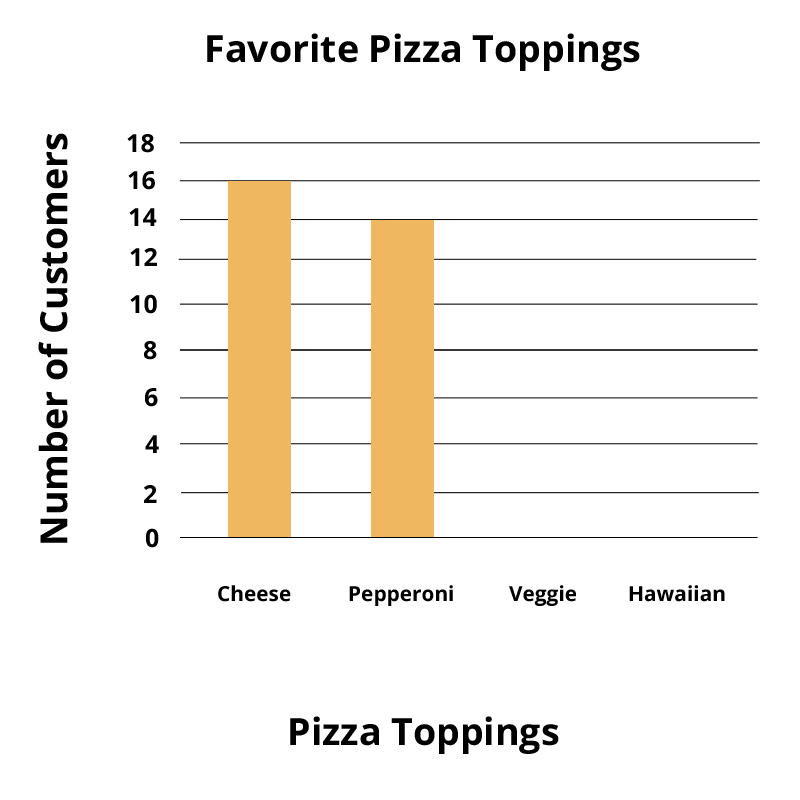
The bar above Pepperoni will line up with 14.
The bar above Veggie will line up with 12.
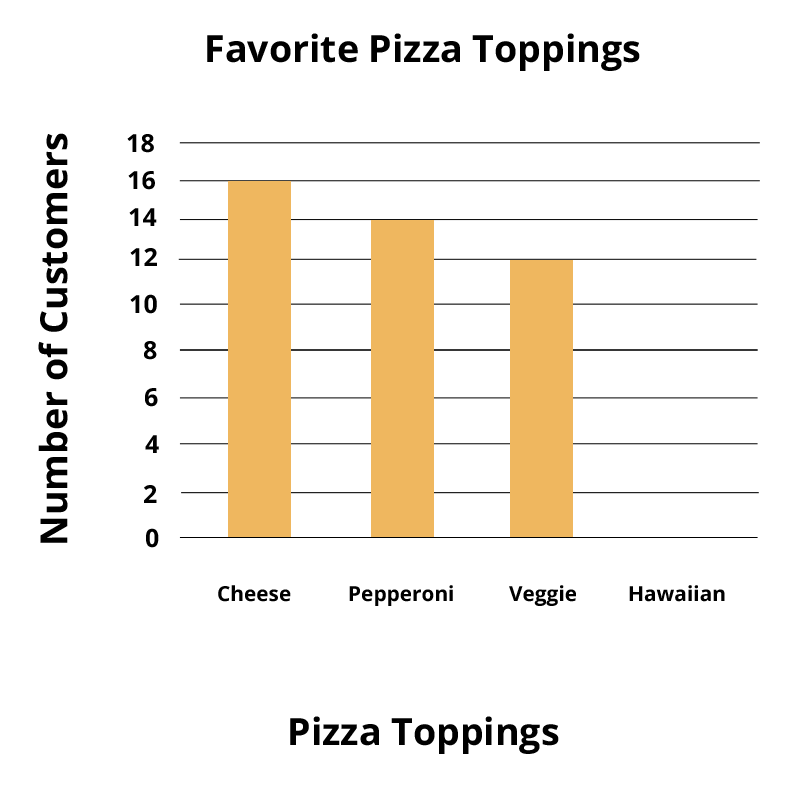
The bar above Hawaiian will line up with 8.

Which kind of pizza topping is the most popular? Use the pictograph and bar graph to help you find the answer.
Click images to enlarge
Cheese is the most popular topping because it has the highest bar and the most dots.
Cheese is the most popular topping because it has the highest bar and the most dots.
Yes! Cheese is the most popular topping because it has the highest bar and the most dots.
You got # out of # correct.
Click the
Retry button for another attempt.
You got a perfect score. Great job!