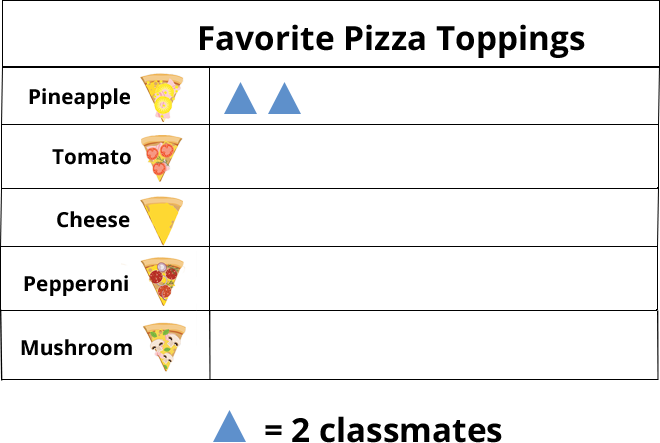
Let’s begin by making a pictograph with Kira’s data. Each triangle represents 2 classmates. How many triangles will you draw next to Pineapple? Use a blue crayon to draw triangles.
Goal:
Goal:

Goal: Make graphs and compare the data.
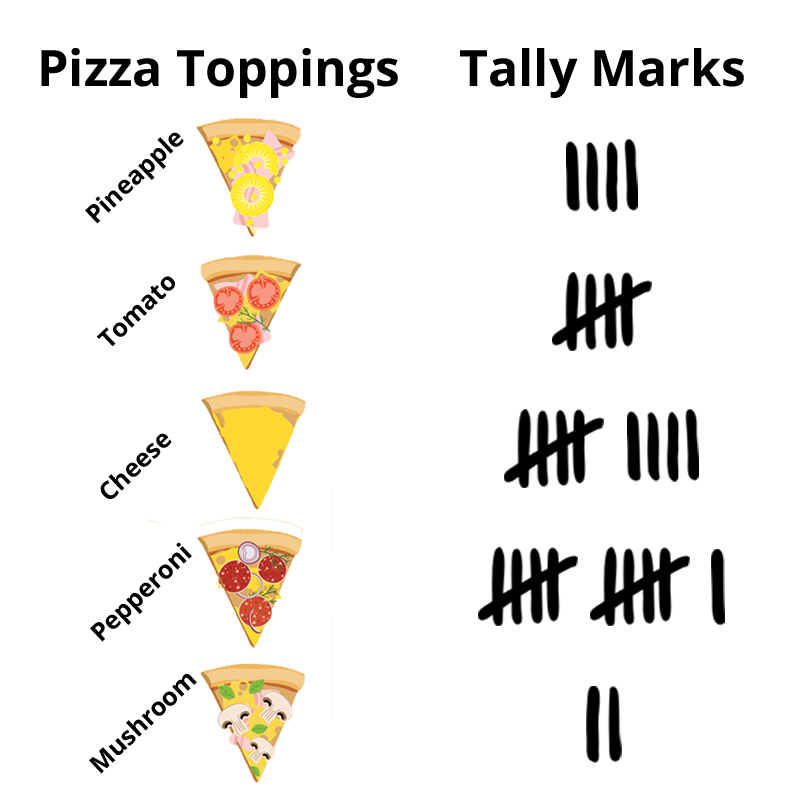
Kira collected data from her classmates about their favorite kinds of pizza. This tally chart shows her data.
Let’s practice making a bar graph and a pictograph with Kira’s data! You will need crayons, a pencil, and this graphing paper .
 Hands-On

Let’s begin by making a pictograph with Kira’s data. Each triangle represents 2 classmates. How many triangles will you draw next to Pineapple? Use a blue crayon to draw triangles.
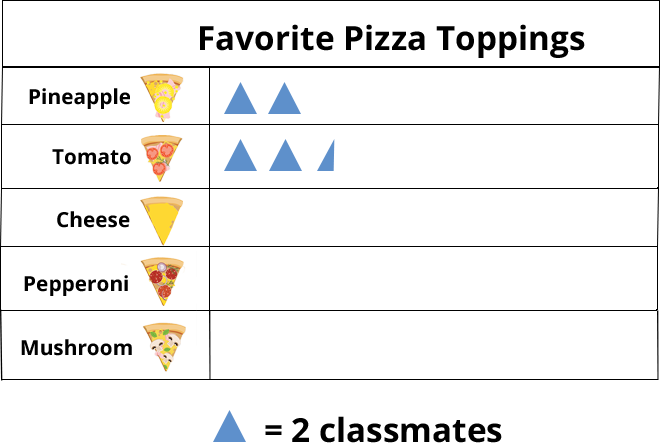
Kira’s tally chart says that 5 students like tomato pizza. If each triangle on the pictograph represents 2 students, how many triangles will you draw next to Tomato?
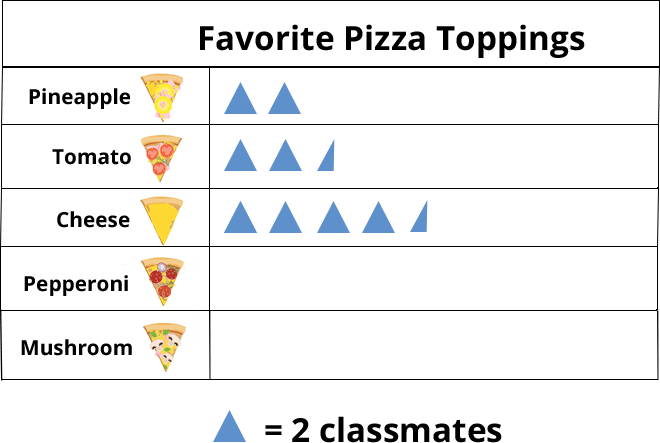
How many triangles will you draw next to Cheese?
How many triangles will you draw next to Pepperoni?
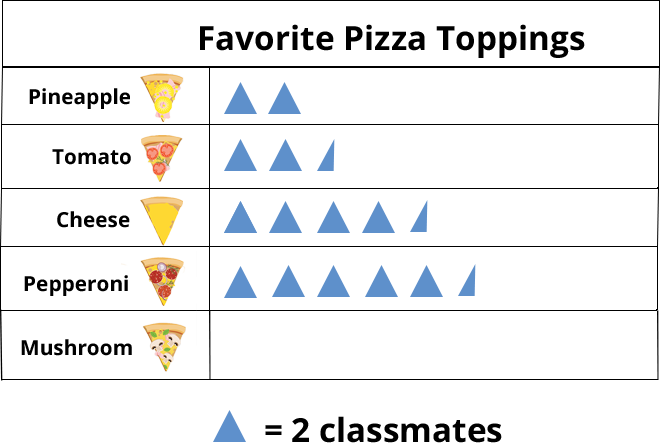
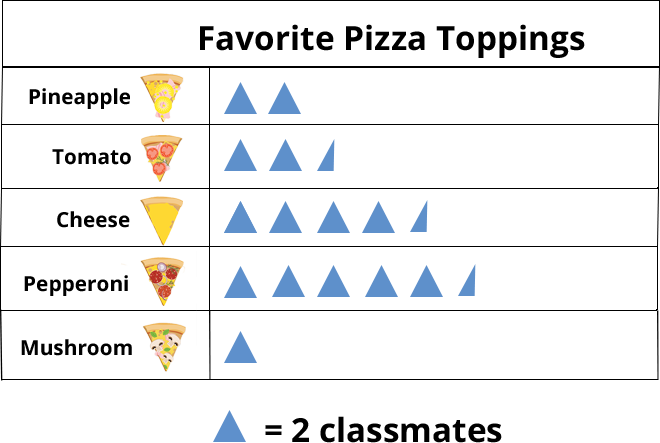
How many triangles will you draw next to Mushroom?
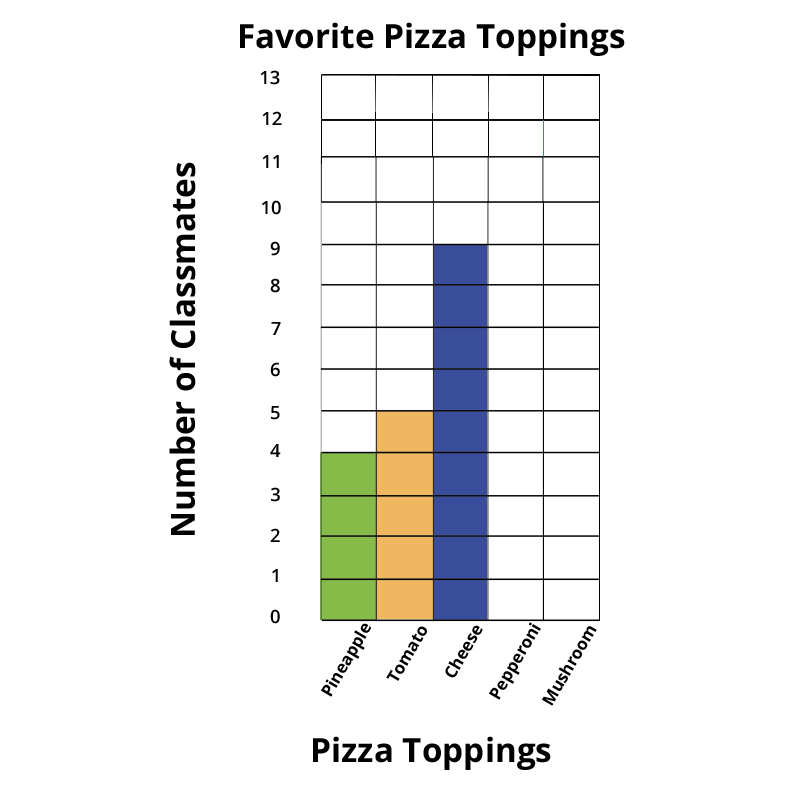
You did it! Now let’s work on the bar graph. 4 students like pineapple on their pizza, so the bar above Pineapple should line up with 4 on the graph. Use any color of crayon to draw the bar.
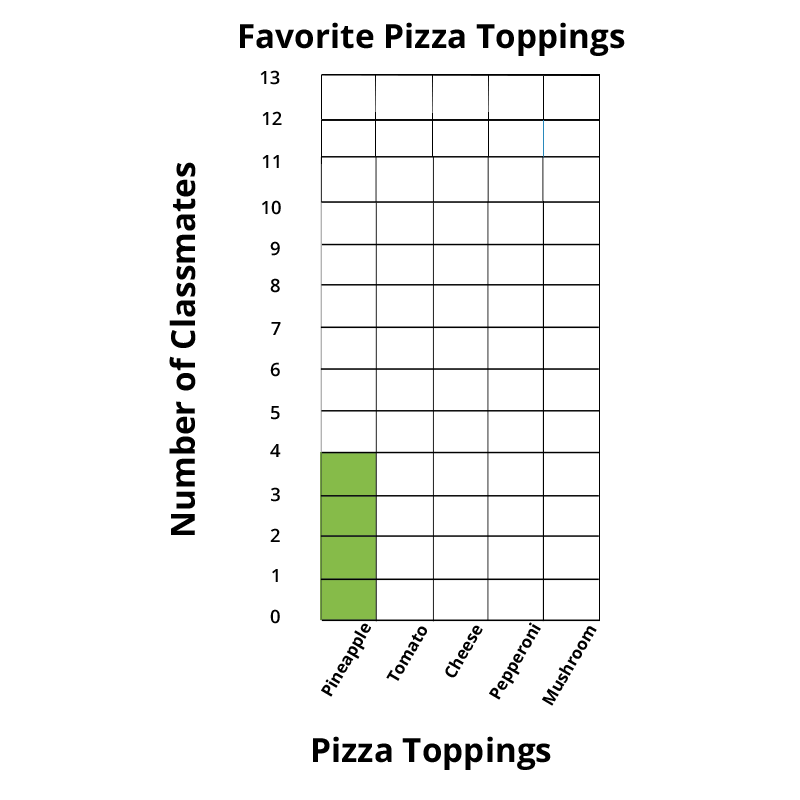
5 students like tomatoes on their pizza. How high will you draw the bar above Tomato?
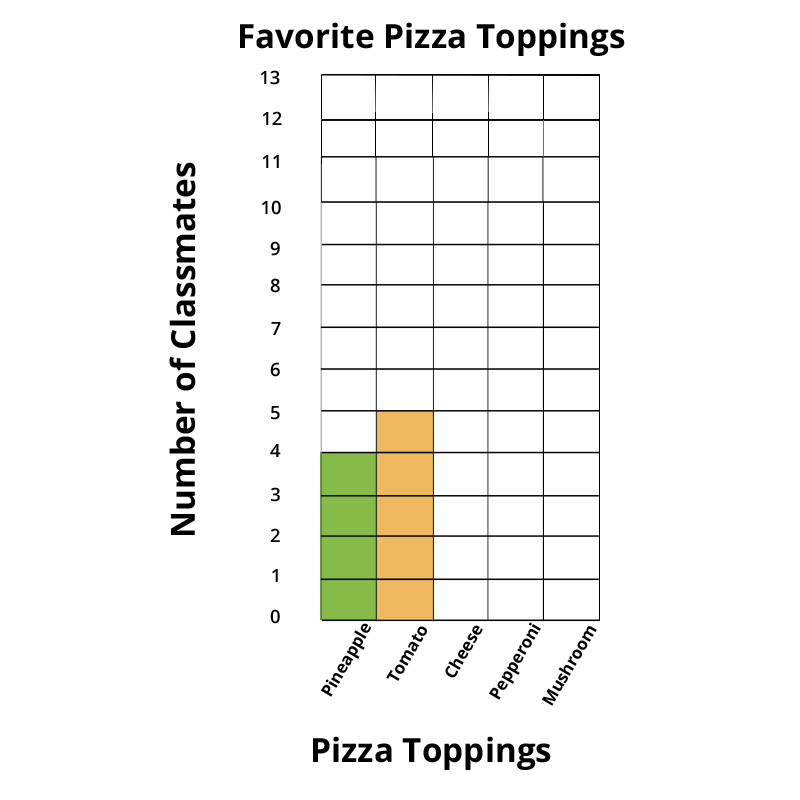
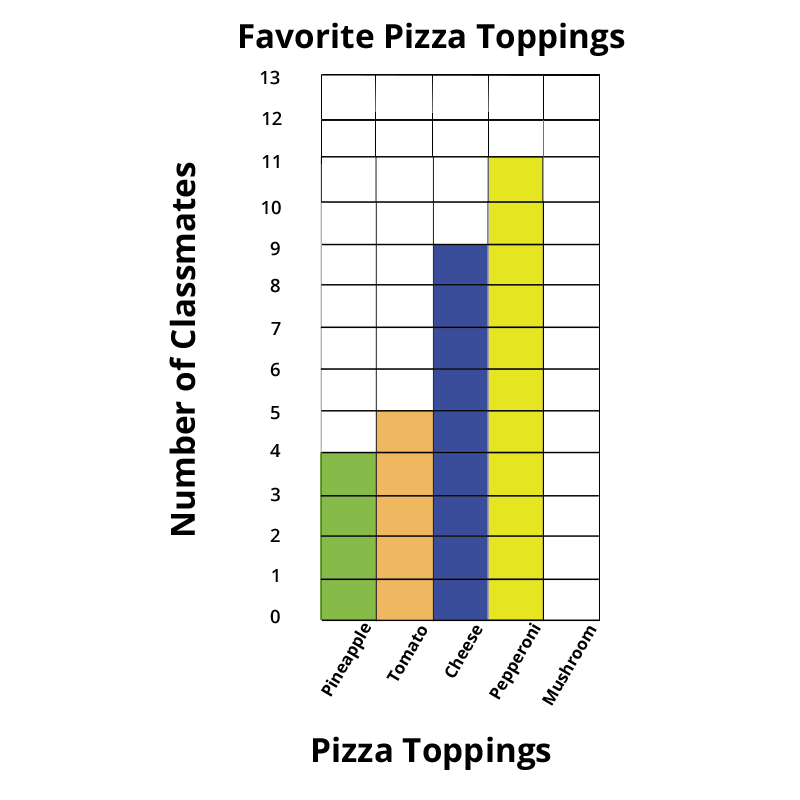
Use another crayon to color the bar above Cheese.
Now draw the bar above Pepperoni.
Finish up the bar graph by drawing the bar above Mushroom.
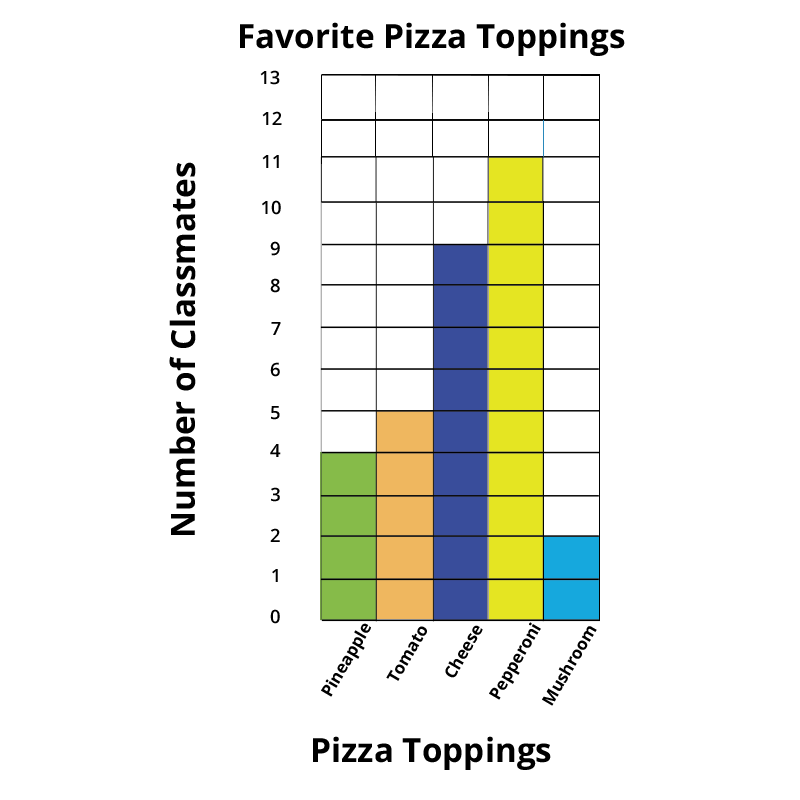
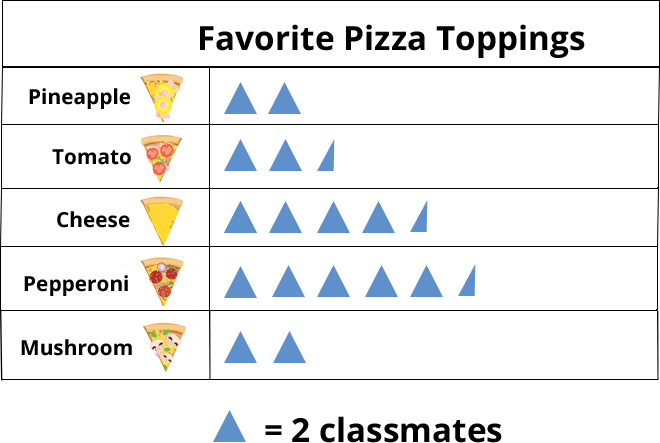
You are right! 4 students voted for pineapple, and 4 students voted for mushroom as a pizza topping. Each topping has 2 triangles in its row.
4 students voted for pineapple, and 4 voted students for mushroom as a pizza topping. Each topping has 2 triangles in its row.
4 students voted for pineapple, and 4 voted students for mushroom as a pizza topping. Each topping has 2 triangles in its row.
Questions answered correctly:
Questions answered incorrectly:
Click the button below to download your worksheet.
Favorite Pizza Topping Data Collection