Let’s Learn!
How do you analyze and compare data on a line plot?
Goal:
Goal:

Think About It!
Goal: Analyze and compare data on a line plot.
We have so many friends ready to help us build our swing set. We need to make sure that we have enough tools. How can we keep track of how many different kinds of tools we have in our toolbox? We will use a line plot!

A line plot is a graph that uses columns of Xs above a number line to show frequency of data. Frequency is the number of times an event or value happens. It helps us see groups in the data. We create a line plot by drawing a number line and labeling it. Then, we record data above the line.
Look at this toolbox. It has a few different kinds of tools in it. You will need more than one of each tool if you are going to have friends help you build the swing set. Look to see how many you have of each tool.
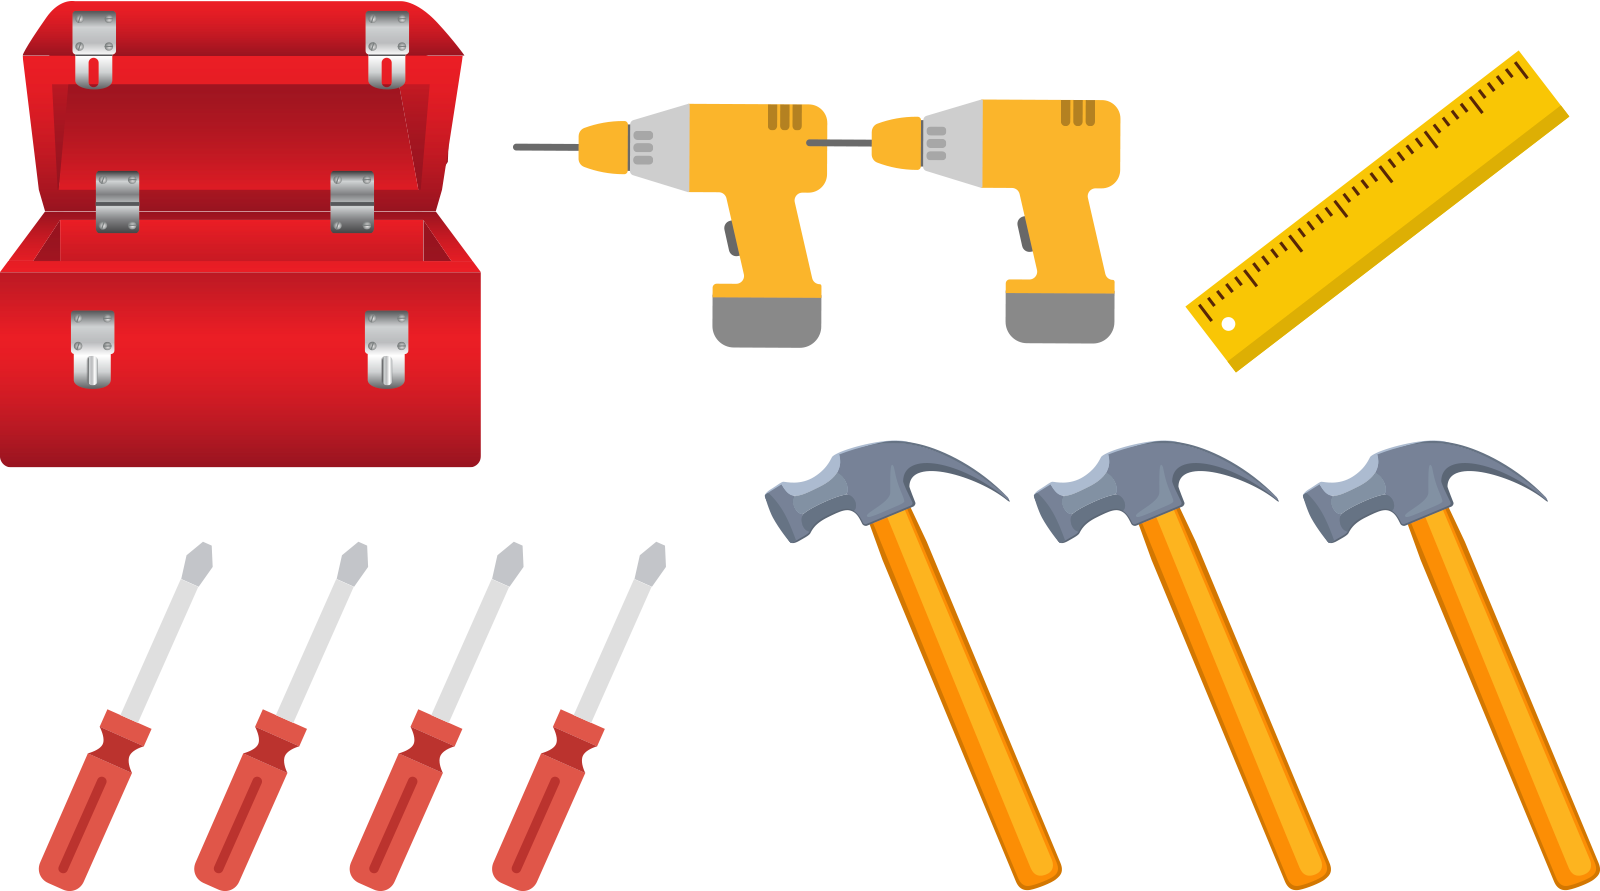
A line plot will help you keep track of the number of tools you have. Look at the line plot below. It shows all of the tools from the toolbox.

Line plot. Title: Number of different tools in the toolbox
Drill: 2, Screwdriver: 4, Ruler: 1, Hammer: 3
Click through the slides below to see how to read this line plot with the toolbox data. You will use this line plot to answer some questions.
This line plot shows the different tools we have in our toolbox. There is a picture for each kind of tool.
What are the different kinds of tools in the toolbox?
There are drills, screwdrivers, hammers, and a ruler.
How many different kinds of tools are in the toolbox?
There are four different kinds of tools.
Look at the picture of the drill. Do you see the Xs above the drill? Each X represents one tool. Count the Xs that you see. There are 2 of them.
That means there are two drills in the toolbox.

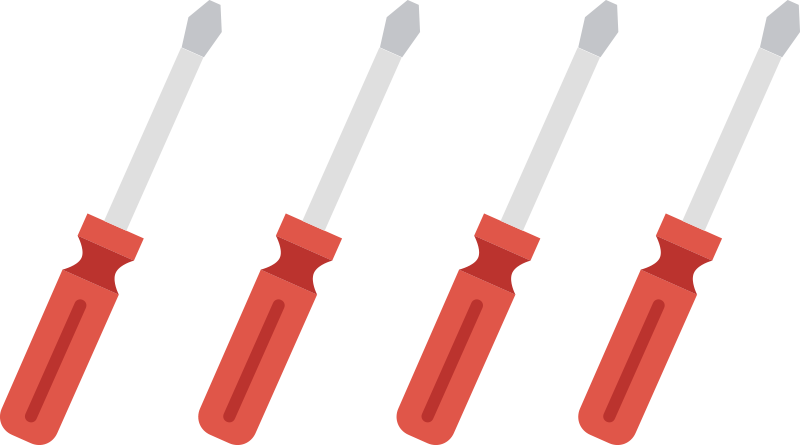
Now look at the picture of the screwdriver. There are Xs above the picture on the plot line. Count the Xs that you see.
How many Xs did you count?
There are 4.
How many screwdrivers are in the toolbox?
There are 4.
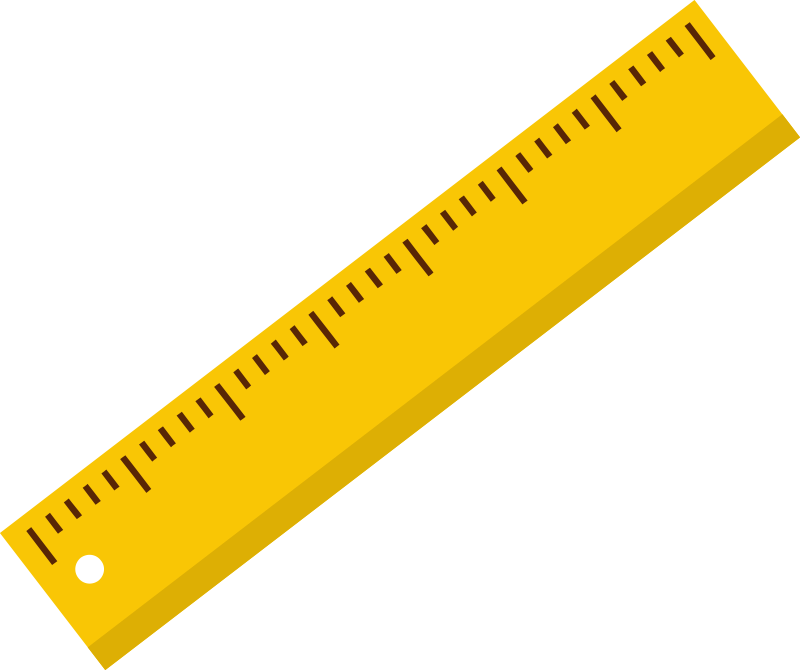
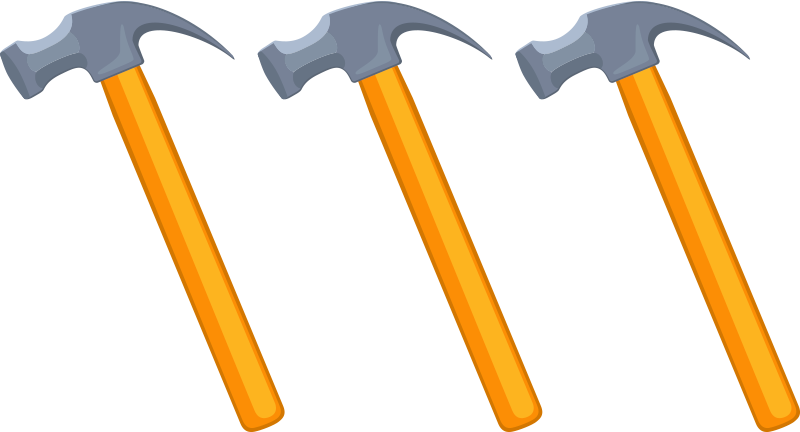
Let’s look at the ruler and the hammer. Count the Xs above each of those pictures on the line plot.
How many rulers are there in the toolbox?
There is only one.
How many hammers are in the toolbox?
There are three hammers.
Now that you know how many of each kind of tool there are in the toolbox, you can compare the tools. Look at the Xs above each tool picture to answer these questions.
Which tool do you have the most of in your toolbox?
The screwdriver has the greatest number of Xs. There are four.
Which tool do you have the fewest of in your toolbox?
The ruler has the fewest number of Xs. There is only one.
We can do one more comparison of these tools using the line plot. Look at the Xs above each tool picture to answer these questions.
Which tools do you have more than two of?
The screwdriver and hammer have more than two Xs.
Which tools do you have fewer of than drills?
There are two drills. The tool that has fewer than two Xs is the ruler. The ruler has only 1 X.
We can find out how many tools there are all together. Look at all of the Xs on the line plot. Count each X on the line plot.
How many tools are in the toolbox all together?
There are 10 Xs on the line plot. That means there are 10 tools total in the toolbox.
Question:
If we have three friends to help us drill holes for the swing set, do we have enough tools?
Line plot. Title: Number of different tools in the toolbox
Drill: 2, Screwdriver: 4, Ruler: 1, Hammer: 3
No. We have only two drills in the toolbox. We do not have enough drills for all three friends.
A line plot helps you keep track of the number of items that you have. You use a line plot to answer questions by counting the Xs. Keep going to learn more about how to use line plots.