Graphs are used to communicate information and to interpret the relationships between physical variables. A position versus time graph is a good way to describe the motion of an object.
Two ways to describe the motion of an object are to describe its speed or its velocity. Speed tells how fast an object is moving, and velocity includes both the speed at which the object moves as well as the direction in which it is moving. Since speed and velocity both include how fast an object is moving, they are graphed in the same way. The position of the object is plotted for each time interval. Time is plotted on the x-axis, and position is plotted on the y-axis.
Recall that slope is the change in the y-values of two points divided by the corresponding change in the x-values.
Since position is plotted on the y-axis, the change in y-value gives the change in position.
Since time is plotted on the x-axis, the change in the x-value gives the change in time.
When these are divided, it is the same as the equation for velocity:
\({ \text{Velocity} = \frac{\text{distance}}{\text{time}} }\)
Thus, the speed or velocity of an object is the slope of its position versus time graph.
Look at this example.
Click image to enlarge.
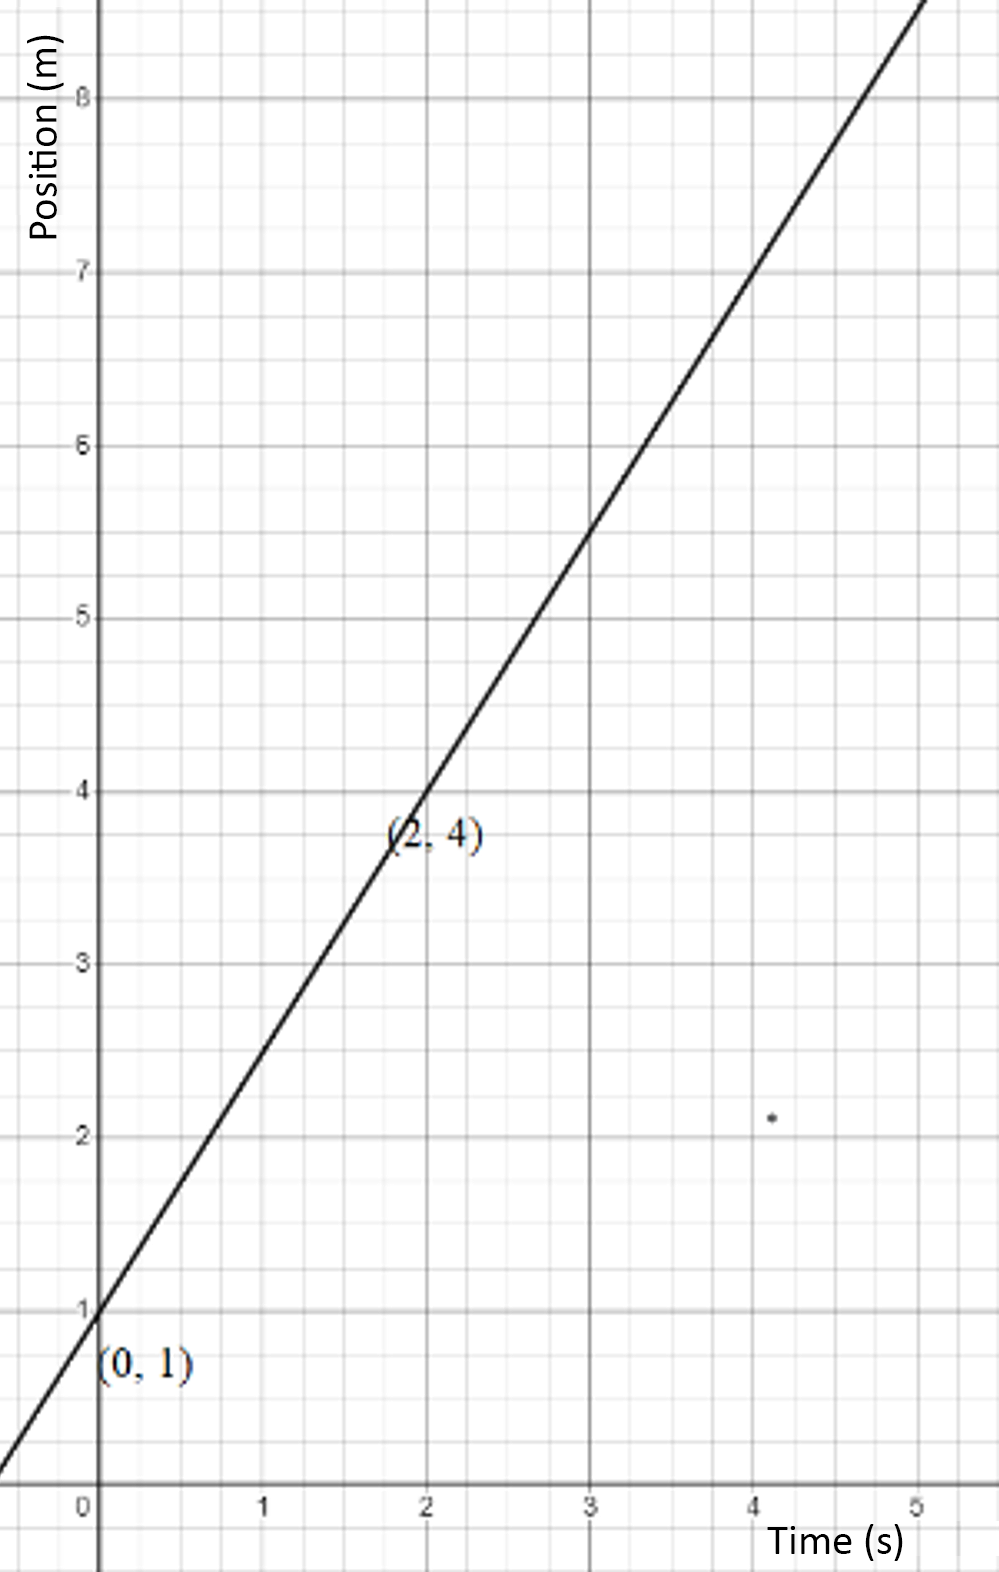
Describe the movement of the object that would produce this graph. What is its velocity?
The object is moving with a positive constant velocity. Its velocity is 1.5 m/s.
To find the slope on a graph, choose two points as shown on the graph. Then, find the change in the y-values divided by the change in the x-values.
\({ \frac{\Delta{y}}{\Delta{x}} = \frac{4 - 1}{2 - 0} = \frac{3}{2} = 1.5 }\)
Since the slope is 1.5, the velocity of the object shown by this graph is 1.5 m/s.
The direction portion of velocity is determined by the sign of the slope. If the slope is positive, then the object is going in the positive direction; if the slope is negative, the object is going in the negative direction. The direction that is considered positive or negative is determined by the coordinate system in the problem and can vary.
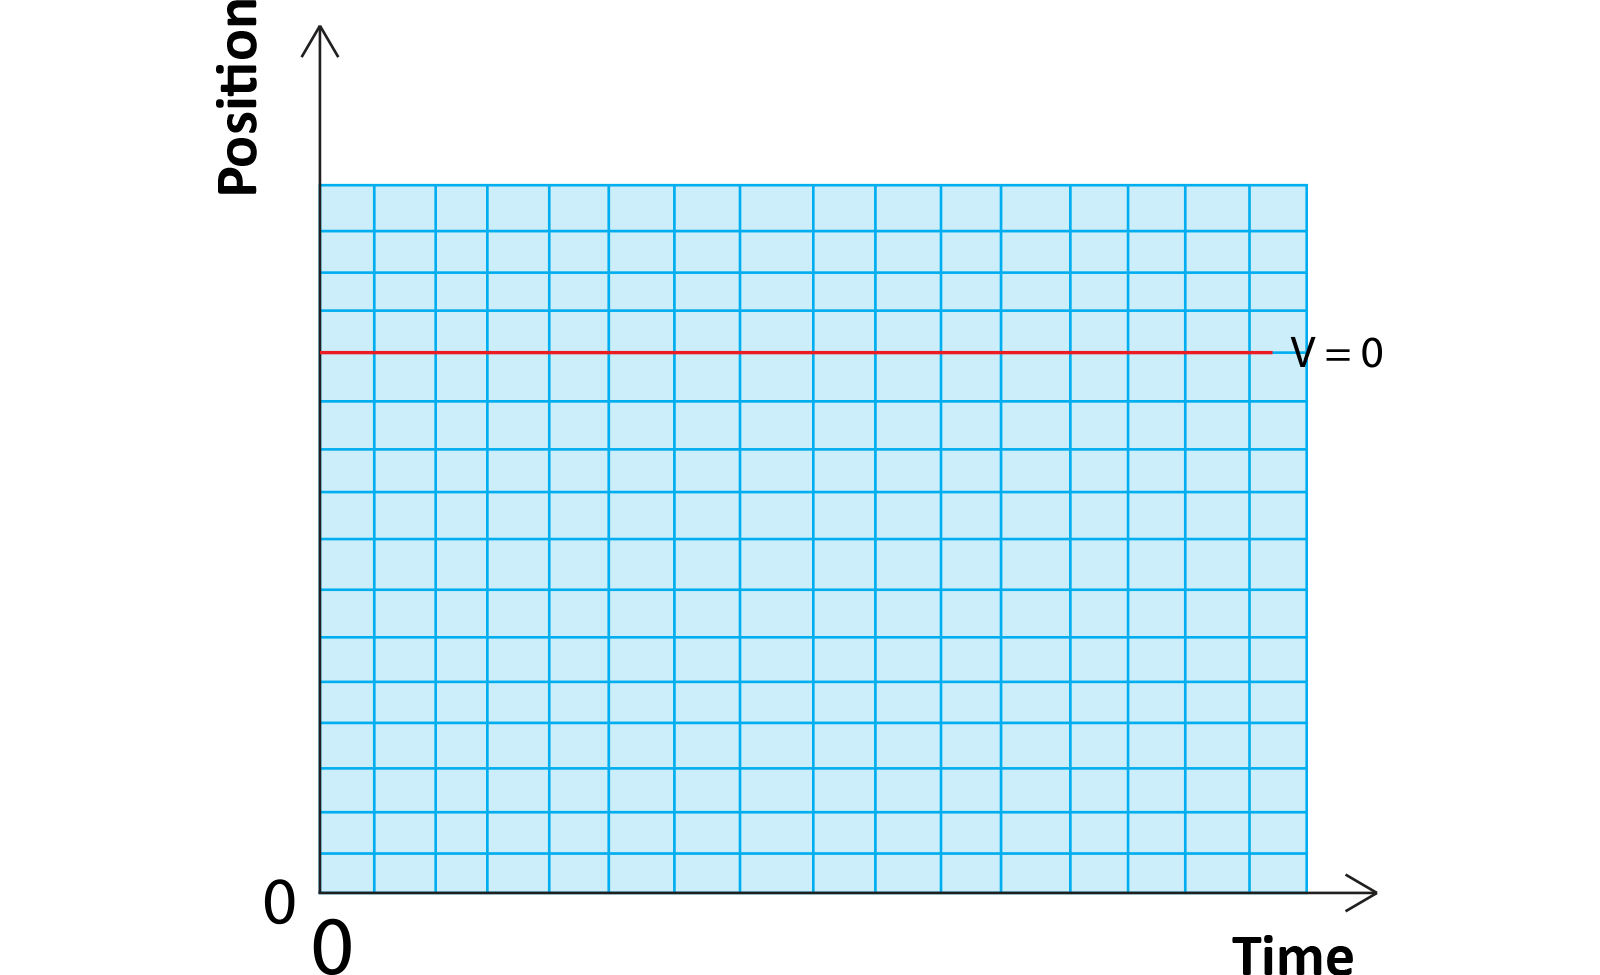
The following images show some examples of different position vs. time graphs.
Zero Speed
|
|


In this assignment you will analyze graphs of position versus time for the movement of an object along a straight path.
Click the Word or PDF link below to download your assignment worksheet. When you have completed the assignment, submit your worksheet to your teacher.
| Word |
