You have reviewed what you know about using a graph to create a table of values and the different forms a linear equation can take. Both of these skills are important in writing a linear equation from its graph.

The tabs below contain some examples that show the process you can use to write a linear equation using its graph. Read through the example on the first tab. The second tab has a video example. As you watch the video, make sure you understand the process and the connection between the graph, its table of values, and its equation.
You may want to use the study guide to follow along. If so, click below to download the study guide.
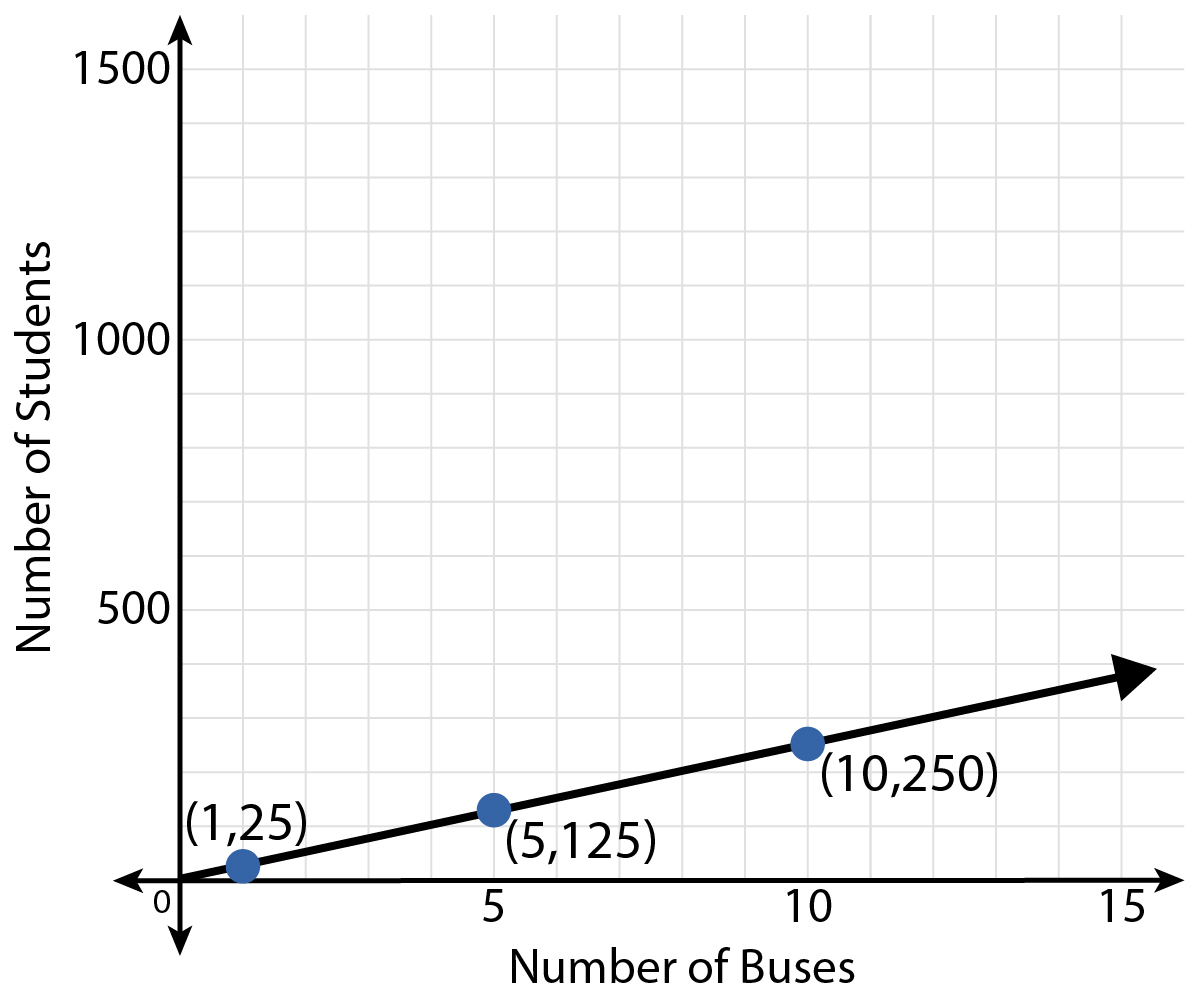
A coordinate plane with the following attributes:
- The x-axis is labeled Number of Buses.
- The y-axis is labeled Number of Students.
- The ordered pairs (1, 25), (5, 125), and (10, 250) are plotted.
- A line extends from (0, 0) through the plotted ordered pairs.
Mr. Alden is a 6th grade social studies teacher who supervises a committee of students. The students are planning a school-wide field trip to the natural history museum. The graph shows the relationship between the number of buses and the number of students needing transportation.
Use the graph to create a table of values. Then use the table of values to write its related linear equation.
The graph of a straight line, its table of values, and its equation all represent the same thing. You can use one representation, such as a graph, to create the others. The steps to complete this problem are in the table below. Click each step to see it applied to this example.
|
When you create your table of values, it is important to label your columns and identify the independent and dependent variables. You have already created the table of values for this scenario. It is this:
The number of buses is the independent variable. It is plotted on the horizontal axis. Additionally, the number of students traveling on this field trip depends on the number of buses available to take them. |
|||||||||||||
|
The graph shows a straight line that touches the origin. The equation will have the form \( y=kx \). |
|||||||||||||
|
The ordered pairs listed on the graph and in the table are \( (1,25) \), \( (5,125) \), and \( (10,250) \). Is there a number you can multiply each \( x \)-value by to arrive at the \( y \)-value?
In each case, you can multiply the \( x \)-value by 25 to arrive at the \( y \)-value. The value of \( k \) is 25. |
|||||||||||||
|
Use the form of the equation you identified in Step 2 and the pattern from Step 3. \[ y = 25x \] |
|||||||||||||
|
Use substitution to check your work. When \( x = 1 \), \( y=25(1) \) When \( x = 5 \), \( y=25(5) \) When \( x = 10 \), \( y=25(10) \) These correspond to the ordered pairs \( (1, 25) \), \( (5, 125) \), and \( (10, 250) \). All of these ordered pairs lie on the line and in the table of values. The equation is correct. |
Let's Watch
Let's work through an example of writing an equation from a table of values.
Use the graph shown to create a table of values. Then use the table of values to write the related linear equation.
I am going to use the four points on the graph to create my table of values. I am only given the coordinates of one point, so I will use the axes to determine the ordered pairs for the other points. The ordered pair for this point is (1,0). This next point is (2,1). And this last point is (3,2).
I will create my table of values. I will have \( x \) in the left column and \( y \) in the right column. I am going to leave space in the middle. We will see why that space is needed soon. Now I add the ordered pairs to the table. For (0,−1) the 0 goes in the \( x \) column and the −1 goes in the \( y \) column. For (1,0) 1 goes in the \( x \) column, 0 goes in the \( y \) column. For (2,1) 2 goes in the \( x \) column and the 1 goes in the \( y \) column, and for (3,2), 3 goes in the \( x \) column, 2 goes in the \( y \)column. My table of values is now complete.
I will use the graph and the table of values to decide which kind of linear equation to use. This graph shows a straight line that does not pass through the origin, so the equation will have the form \( y=x+b \). The ordered pairs listed in this table of values are (0,−1), (1,0), (2,1), (3,2). Let's see if there is a number we can add to each \( x \)-value to arrive at the \( y \)-value. I will add a column to the table, and I will label it "operation". To get from 0 to −1 I would add −1. 1 to 0, I can add −1. \( 2+(-1)=1 \), \( 3+(-1)=2 \). In each case, you can add −1 to the \( x \)-value and arrive at the \( y \)-value. This means the value of the \( b \) in the equation is −1. The equation for this line is \( y=x+(-1) \).
Together we have worked through an example of creating an equation from a line and a table of values. Refer to this video if you need help when working on this type of problem.
Question
Which form of a linear equation always touches or passes through the origin?
\( y = kx \)
