Step by Step
What are the steps for interpreting data?
Goal:
Goal:
It's important to follow these four steps when interpreting data on a graph, chart, or timeline. Click the hand to reveal each step.

Step 1:
Look at the title.

Step 2:
Read the labels.

Step 3:
Look for a legend or key to explain symbols or icons.

Step 4:
Read the data or information.
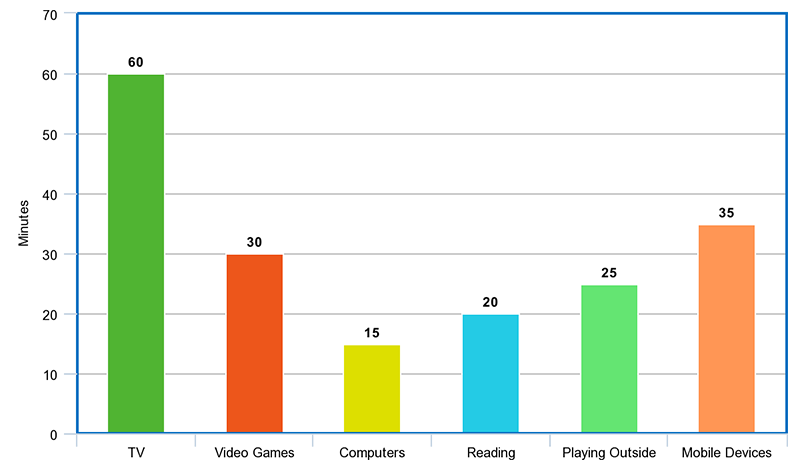
Using these steps, interpret the graph below. Then answer the questions.
Minutes per day children ages 0-8
spend on activities outside of school.
Question
What is the title of the graph?
Minutes per day children ages 0-8 spend on activities outside of school
Question
What activity do children spend the most time doing?
Watching TV