Let's have a look...
Recall that linear inequalities are mathematical statements that compare two expressions that are NOT equal.
Examples of Linear Inequalities
These statements are all linear inequalities.
\(y > - 3x + 1\)
\(y \leq 7x + 2\)
\(y > \frac{1}{2}x + 4\)
Notice that linear inequalities contain numbers, operational symbols, one of the inequality symbols such as \(> ,\ < ,\ \geq ,\ \leq ,\) or \(\neq ,\) and two variables, \(x\) and \(y\). Since there are two variables, you can graph linear inequalities on the coordinate plane.
Study the slideshow below to review what you have learned about the graphs of linear inequalities.
The Boundary Line
The boundary line divides the coordinate plane into a solution area and a non-solution area. In other words, it divides the coordinate plane into an area with solutions and an area that does not have solutions as summarized below.
| If the boundary line on the graph of an inequality is dashed, then it is a strict inequality, and the ordered pairs that lie along that line are NOT solutions of the inequality. | If the boundary line on the graph of an inequality is solid, then it is a non-strict inequality, and the ordered pairs that lie along that line are solutions to the inequality. |
The boundary line on this graph is dashed.
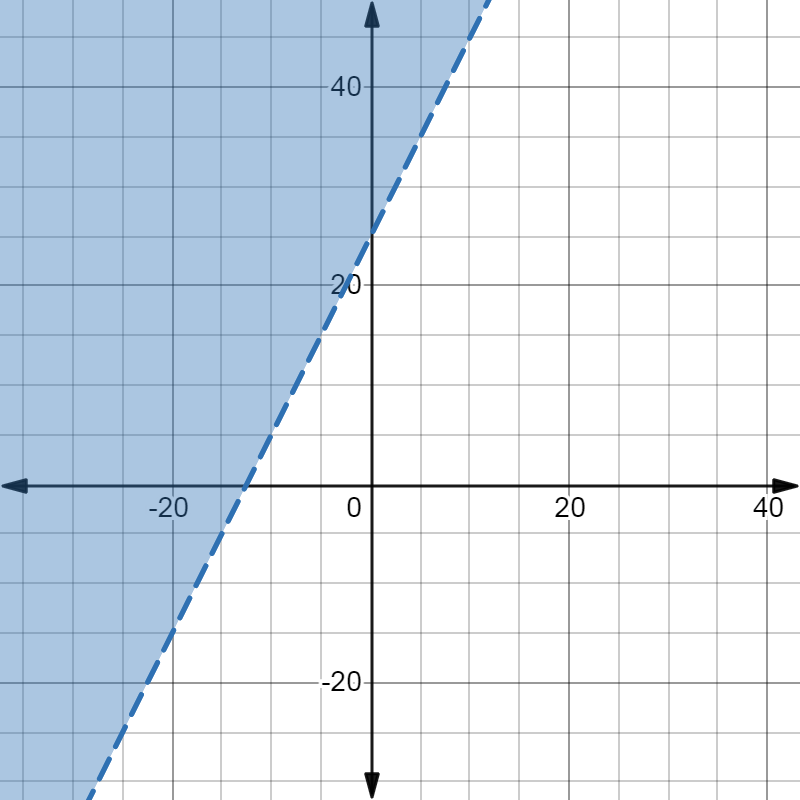
Is the linear inequality a strict or a non-strict inequality? What does this say about the ordered pairs that lie along the boundary line?
This boundary line is dashed, which means the inequality symbol is one of the strict inequality symbols, \(<\) or \(>\).
The ordered pairs that lie along this line are NOT solutions of the inequality.
The Shaded Area
The graph of a linear inequality will include shading to give you a visual representation of all the ordered pairs that make the linear inequality true. The shaded area is the side of the line where the solutions of the inequality lie.
Remember
Ordered pairs that are within the shaded area are solutions to the linear inequality. Ordered pairs that are NOT within the shaded area are NOT solutions to the linear inequality.
This graph is shaded to the left of the boundary line.
What does this say about the ordered pairs that are to the left of the boundary line?
All the ordered pairs that lie in the shaded region make the inequality true.
If an ordered pair is not in the shaded region or it is along the dashed boundary line, then it does not satisfy the inequality.

See how much you remember about linear inequalities by completing the activity below. Answer each question, then click the question to check your answer. You will need to use this graph to answer the questions.
