
Let's Investigate
The time that it takes for a pendulum to make one back-and-forth swing is called its period. In this investigation you will explore variables that affect the period of the pendulum. You will study two variables, the mass of the pendulum’s bob and the length of the string of the pendulum.
Before you begin, click the Word or PDF link below to download your assignment worksheet. Then, read through the tabs below for the instructions. When you have completed the lab and the assignment, submit your worksheet to your teacher.
| Word |
Attribution: PhET Interactive Simulations | University of Colorado | https://phet.colorado.edu
The investigation consists of the parts shown below. Click the button below to download the instructions OR click through each tab to read and follow the steps to complete the investigation.
Mass of
Pendulum Bob
Length of
Pendulum
In this part of the investigation, you will explore how mass affects the period of the pendulum.
Click the “Lab” mode of the simulation. You will see the pendulum in the center of the page. Click the “Pause” button so that the pendulum will not start swinging until you are ready.
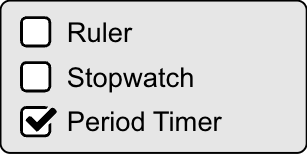
Toward the lower left side is a section with measuring devices. Select the period timer from this section. Notice that a period time appears near the right side of the screen. This timer measures the length of time for one period of the pendulum.
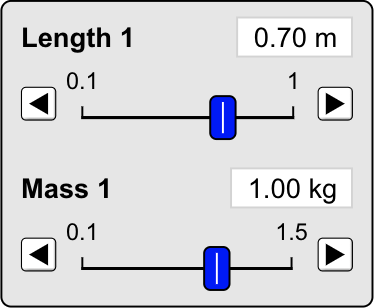
On the right side of the screen is a section that has sliders for the length and the mass of the pendulum. These sliders will be used to change these variables throughout the investigation. The default values are 0.70 m for the length and 1.00 kg for the mass.
-
Keep the length at 0.70 m. Change the mass to 0.50 kg. Pull the pendulum to the right at a 45° angle. Click “Play” on the period timer and click “Play” on the simulation. The pendulum will start to swing. When it reaches the bottom of its swing, the period timer will start and time how long it takes to make one complete vibration. After the period timer stops, click the “Pause” button. Record the mass and period in the data table on Question 1 of your assignment worksheet.
-
To reset the pendulum, click on the red stop button near the bottom of the screen. Set the mass to 1.00 kg. Pull the pendulum to the right at a 45° angle and use the period timer to determine the amount of time it takes for one complete vibration. Record the mass and period in the data table on Question 1 of your assignment worksheet.
-
Click on the red stop button near the bottom of the screen to reset the pendulum. Choose a different mass. Keep the angle for the pendulum at 45° and find the period of the pendulum with the new mass. Record the mass and period in the data table on Question 1 of your assignment worksheet.
-
Repeat Step 3 for one more different mass of the pendulum bob.
-
Plot a graph of period vs. mass with period on the y-axis and mass on the x-axis. You can make the graph by hand, or you can use an online graphing program. Insert the graph on Question 2 of your assignment worksheet.
-
Use the data table and graph to answer Question 3 on your assignment worksheet.
In this part of the investigation, you will explore how the length affects the period of the pendulum. You will still use the “Lab” mode of the Pendulum Lab simulation. Keep the mass of the pendulum bob at 1.00 kg throughout this section. To reset the pendulum, click on the red stop button near the bottom of the screen.
-
Use the sliders on the right side to set the length of the pendulum to 0.3 m. Pull the pendulum back to a 45° angle and use the period timer to determine the period of the pendulum. Record the length and the period in the data table on Question 4 of your assignment worksheet.
-
Click the red stop button near the bottom of the screen to reset the pendulum, then change the length to 0.5 m. Pull the pendulum back to a 45° and use the period timer to determine the period of the pendulum. Record the length and the period in the data table on Question 4 of your assignment worksheet.
-
Repeat Step 3 two more times with different pendulum lengths.
-
Plot a graph of period vs. length with period on the y-axis and mass on the x-axis. Insert the graph on Question 5 of your assignment worksheet.
-
Use the data table and graph to answer Question 6 on your assignment worksheet.
