
A table of values is an organized list of the \( (x,\ y) \) ordered pairs that lie along the graph of a line in the coordinate plane. To convert the information on a graph to a table, start by creating a table with labeled columns, and then identify the marked ordered pairs along the line. Finish by filling in the table using the coordinates of the marked ordered pairs.
For Example
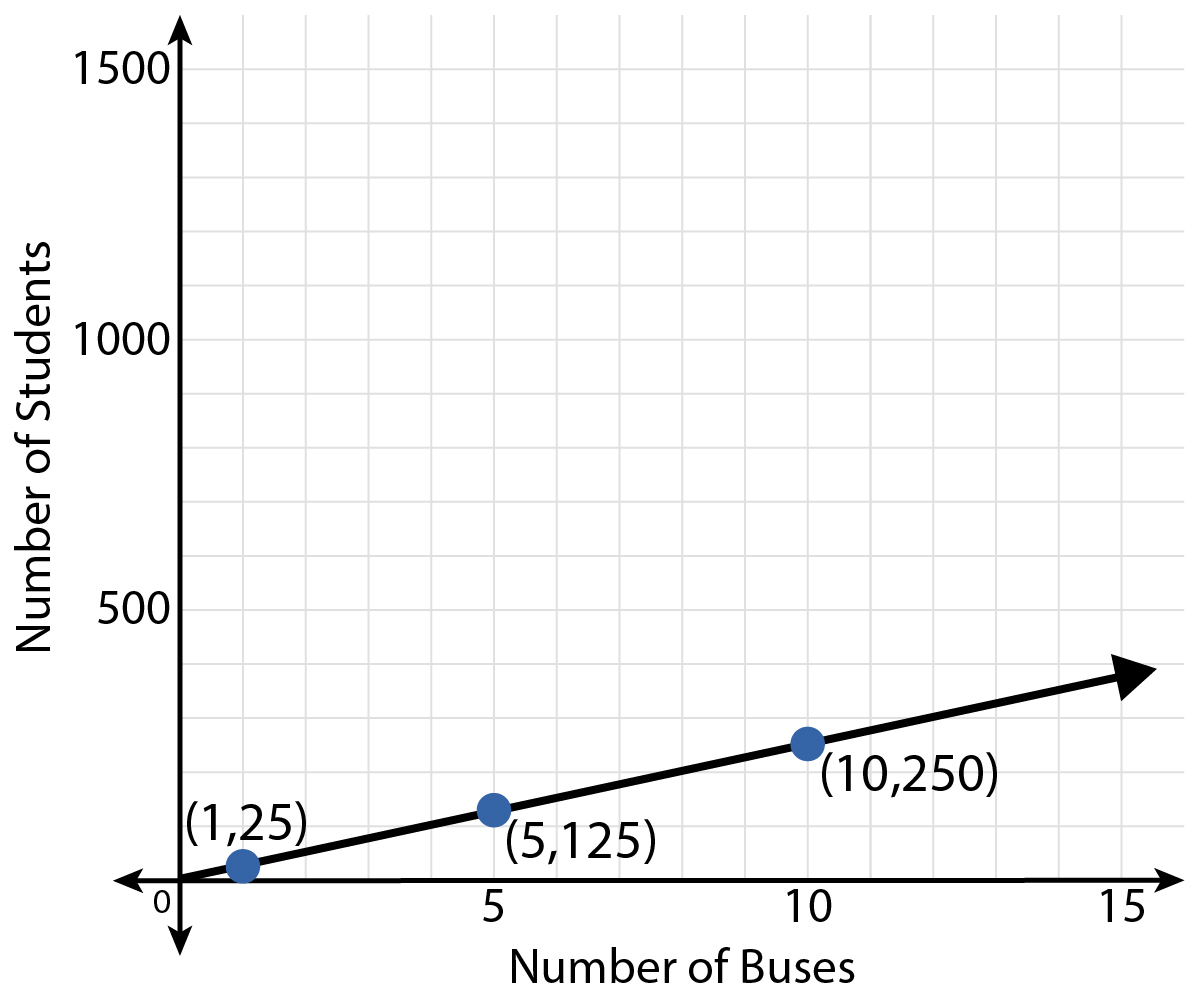
Mr. Alden is a 6th grade social studies teacher who supervises a committee of students. The students are planning a school-wide field trip to the natural history museum. The graph shows the relationship between the number of buses required and the number of students needing transportation.
Use the graph to create a table of values.
A coordinate plane with the following attributes:
- The x-axis is labeled Number of Buses.
- The y-axis is labeled Number of Students.
- The ordered pairs (1, 25), (5, 125), and (10, 250) are plotted.
- A line extends from (0, 0) through the plotted ordered pairs.
The table shows the steps to create a table of values from a graph. Click each step to see it applied to this example problem.
Use the labeling on the axes of the graph to create the table columns.
|
|||||||||
The first number is the \( x \)-coordinate, and the second number is the \( y \)-coordinate. The ordered pairs marked along the line are \( (1,\ 25) \), \( (5,\ 125) \), and \( (10,\ 250) \). |
|||||||||
The \( x \)-coordinates represent the number of buses. The \( y \)-coordinates represent the number of students. Notice that these \( (x,\ y) \) coordinates form proportional ratios, so this is a ratio table. Not all tables of values are ratio tables.
|
When you use a graph to create a table of values, keep in mind that there is an infinite number of ordered pairs that lie along the line. Sometimes the ordered pairs are marked or are easily readable using the axes. You can include any ordered pair that lies along the line in your table of values.
Let's Practice
Practice what you know about using a graph to create its related table of values with the activity below. Select the best answer for each question.
Which ordered pair would not be listed in the table of values that is related to this graph?
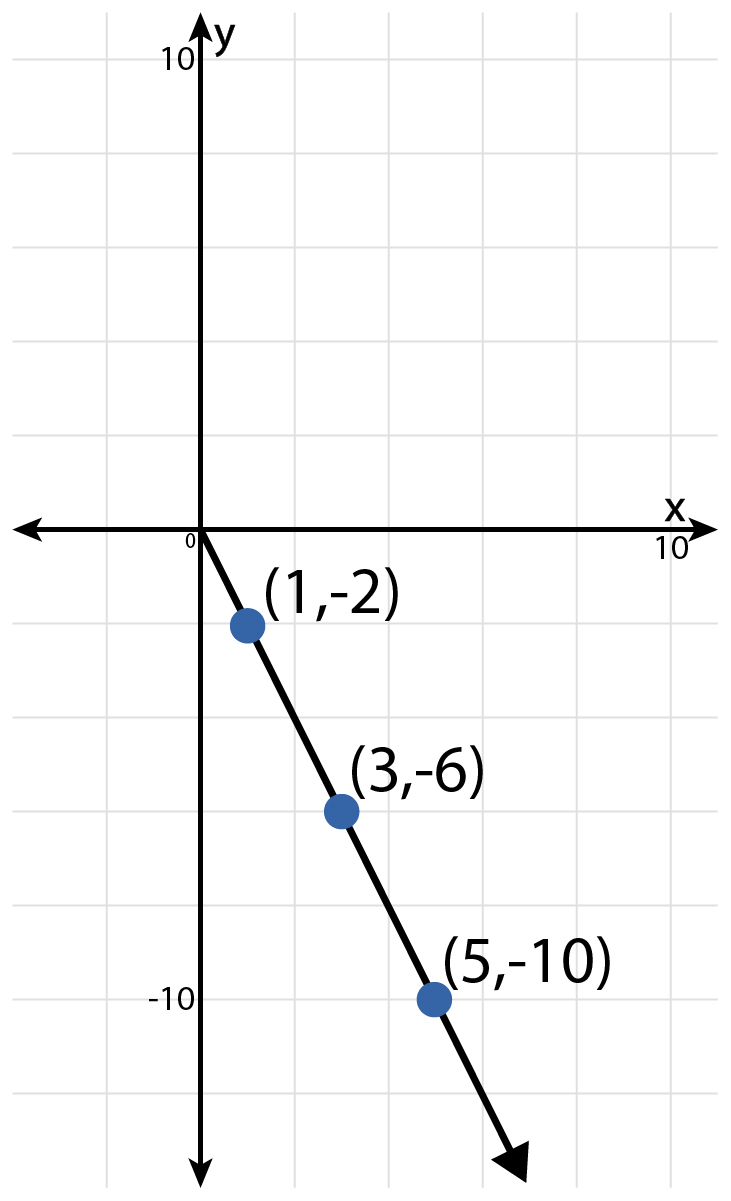
A linear graph contains the ordered pairs (1, −2), (3, −6), and (5, −10).
- \( (3,\ 6) \)
- \( (5, - 10) \)
- \( (0,\ 0) \)
Which statement about a graph and its related table of values is TRUE?
- The ordered pairs on a line are not related to the ordered pairs listed in a table of values.
- There is a limited number of ordered pairs that lie along the line and in the table of values.
- You can include any ordered pair that lies along the line in your table of values.
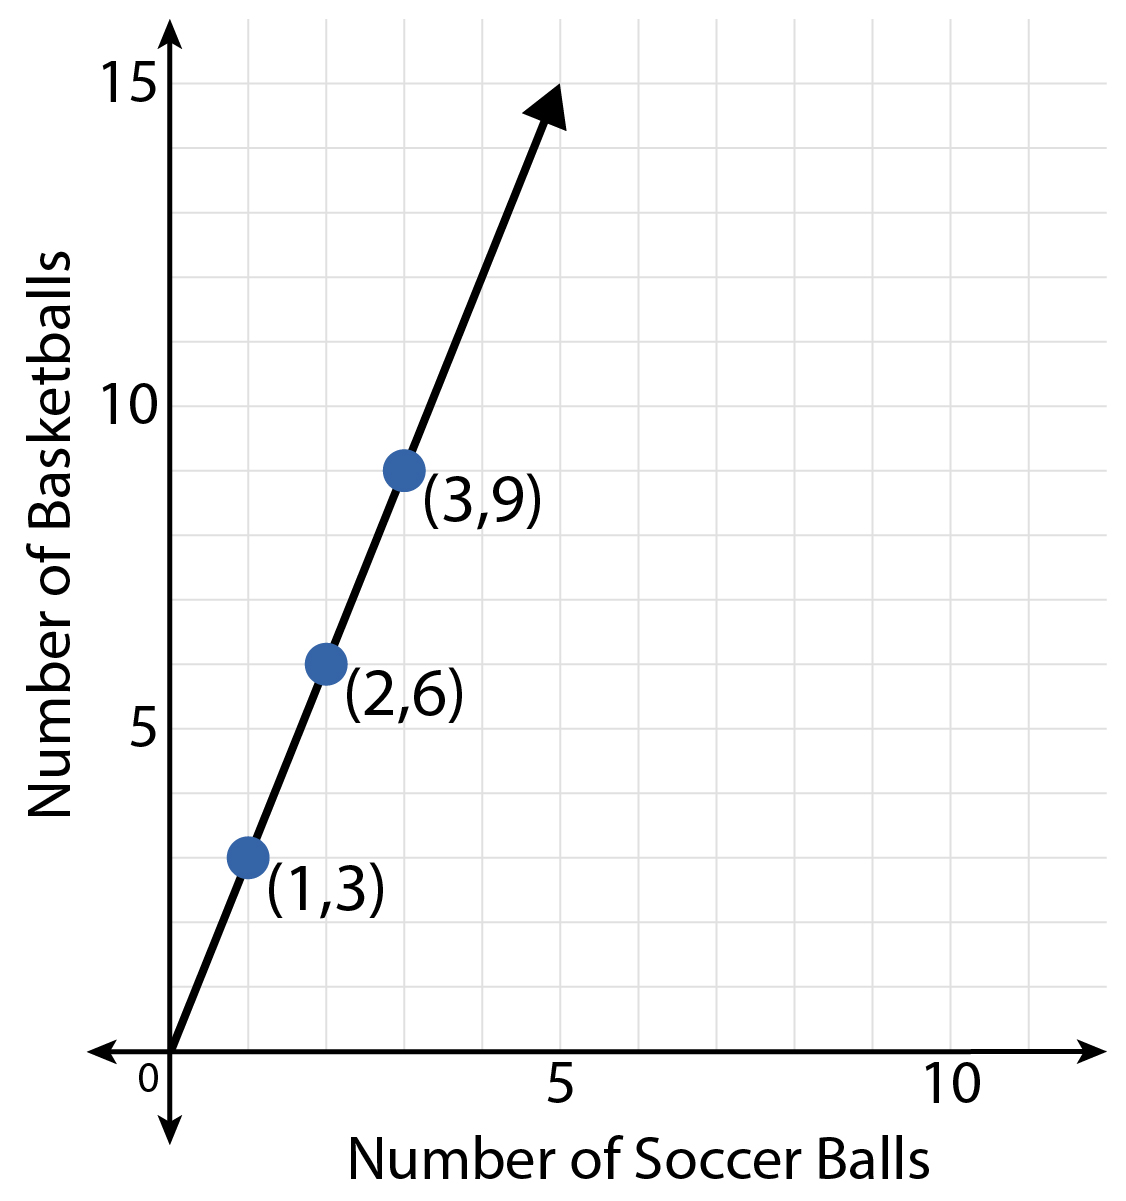
What column titles should you use when creating a table of values to represent the line on this graph?
A coordinate plane with the following attributes:
- The x-axis is labeled Number of Soccer Balls.
- The y-axis is labeled Number of Basketballs.
- The ordered pairs (1, 3), (2, 6), and (3, 9) are plotted.
- A line extends from (0, 0) through the plotted ordered pairs.
- First Column: Number of Basketballs
Second Column: Number of Soccer Balls - First Column: Number of Soccer Balls
Second Column: Number of Basketballs - First Column: Soccer Balls Used
Second Column: Basketballs Deflated
Name an ordered pair that lies along the line in the graph used to create this table of values.
| \( \displaystyle x \) | \( \displaystyle y \) |
|---|---|
\( \displaystyle 1 \) |
\( \displaystyle - 4 \) |
\( \displaystyle 2 \) |
\( \displaystyle - 8 \) |
\( \displaystyle 3 \) |
\( \displaystyle - 12 \) |
- \( (1,\ 4) \)
- \( (2, - 8) \)
- \( ( - 12,\ 3) \)
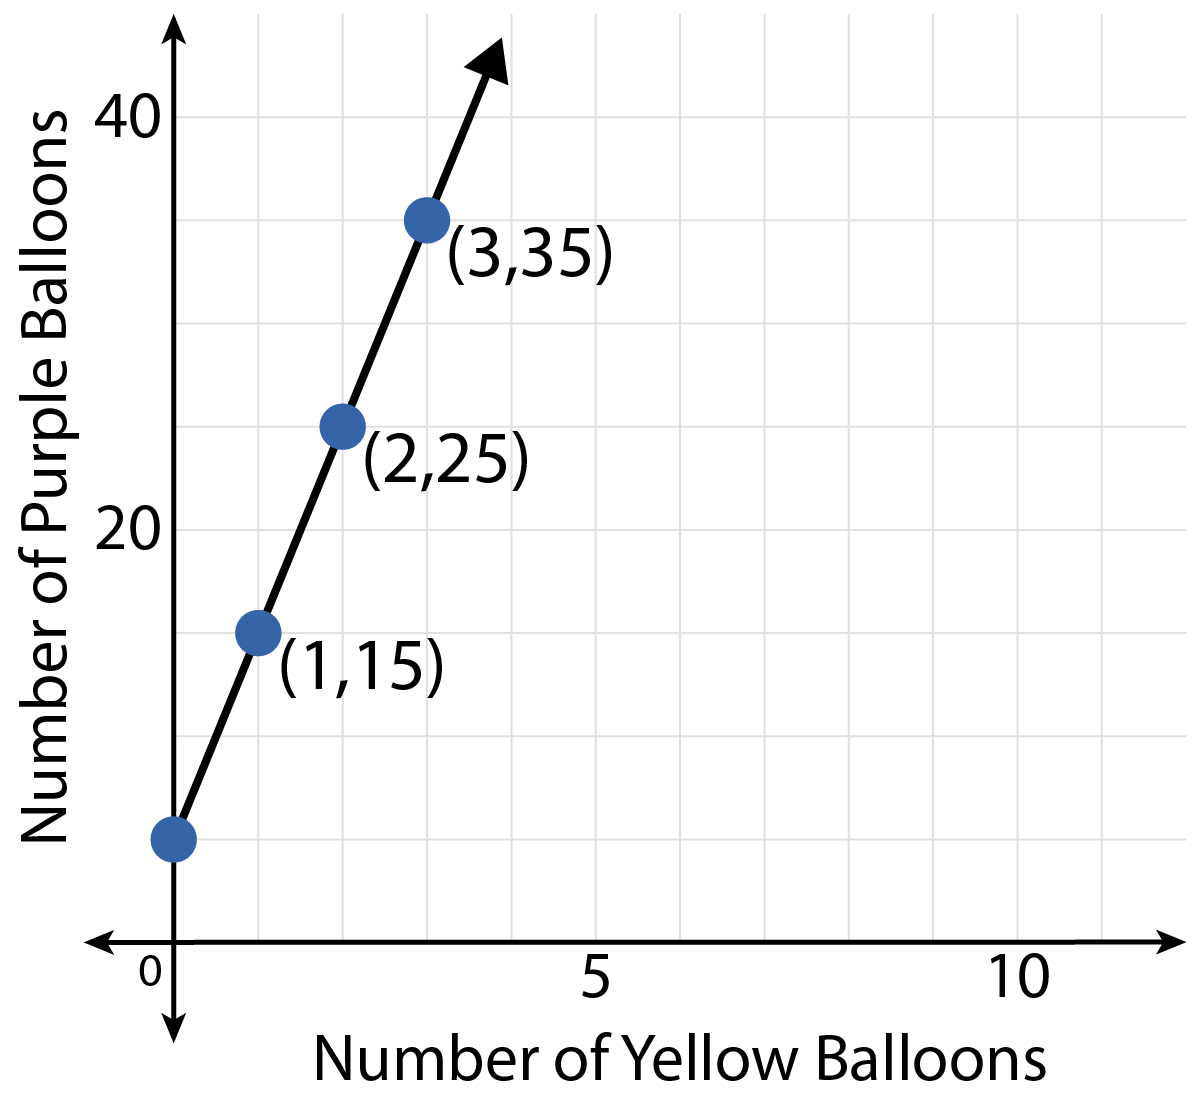
What relationship does this graph show?
A coordinate plane with the following attributes:
- The x-axis is labeled Number of Yellow Balloons.
- The y-axis is labeled Number of Purple Balloons.
- The ordered pairs (1, 15), (2, 25), and (3, 35) are plotted.
- A line extends from (1, 0) through the plotted ordered pairs.
- the number of yellow balloons to the number of purple balloons
- the number of purple balloons to the number of yellow balloons
- the total number of yellow and purple balloons to the number of windows
Summary
Questions answered correctly:
Questions answered incorrectly:
