Think you got it?
You can use the graph to write the system of linear inequalities. The steps for accomplishing this are shown in the table below.
| Step 1: | Choose one inequality and write the equation of the boundary line. |
|---|---|
| Step 2: |
Determine which inequality symbol to use. If the line is dashed, then you will use < or >. If the line is solid, then you will use \(\leq\) or \(\geq\). |
| Step 3: |
Repeat steps 1 and 2 for the second linear inequality. |
| Step 4: |
Write the system of linear inequalities. |
Let's Practice
Practice using graphs to write systems of inequalities by completing the activity below. Answer the question on each tab, then check your answer.
Write the system of linear inequalities shown on this graph.
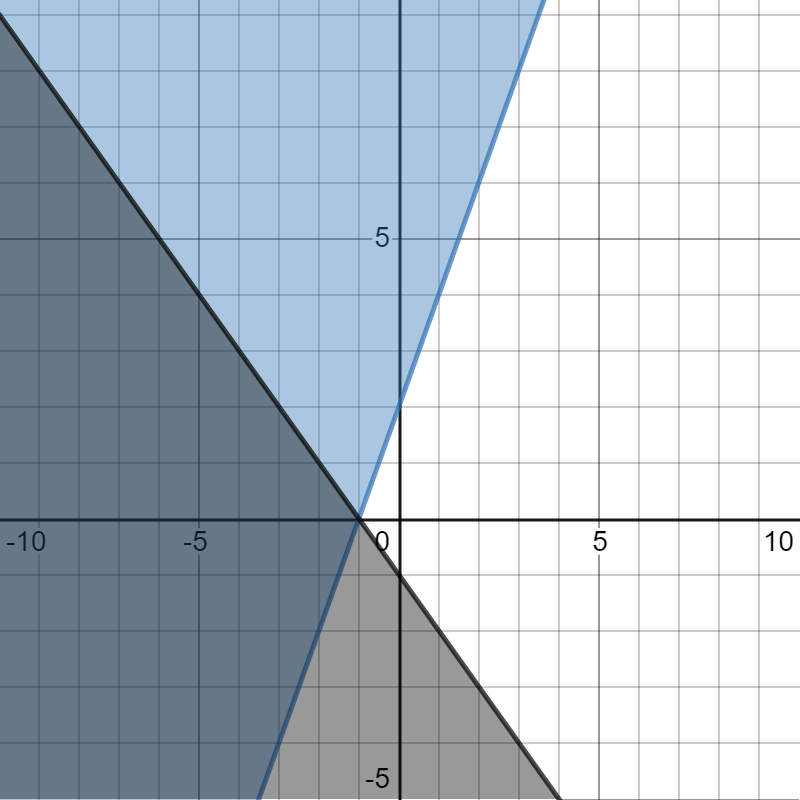
Two linear inequalities graphed on a coordinate plane where the shaded intersected regions are darker. One graph has a solid line, a y-intercept of (0,2), a slope of 2 and is shaded above the boundary line. The other graph has a solid line, a y-intercept of (0,-1), a slope of -1 and is shaded below the boundary line.
\( y \geq 2x + 2 \)
\( y \leq - x - 1 \)
If you need help arriving at this answer, click the solution button.
|
Step 1: Choose one inequality and write the equation of the boundary line. |
Start with the blue line that slopes up to the left. Its \(y\) -intercept is (0, 2). By counting, you can see the slope is \(m = \frac{2}{1} = 2\). The equation of this boundary line is \(y = 2x + 2\). |
|
Step 2: Determine which inequality symbol to use. |
The line is solid, so you will use either \(\leq\) or \(\geq\). Since the shading is on the top side of the line, use \(\geq\). This inequality is \(y \geq 2x + 2\). |
|
Step 3: Repeat steps 1 and 2 for the second linear inequality. |
For the black line that slopes down to the right, the \(y\)-intercept is \((0,\ - 1)\). By counting on the graph, the slope is \(m = \frac{1}{- 1} = - 1\). This is a solid line with shading below, so use the symbol \(\leq\). This inequality is \(y \leq - x - 1\). |
|
Step 4: Write the system of linear inequalities. |
\( y \geq 2x + 2 \) \( y \leq - x - 1 \) |
Write the system of linear inequalities shown on this graph.
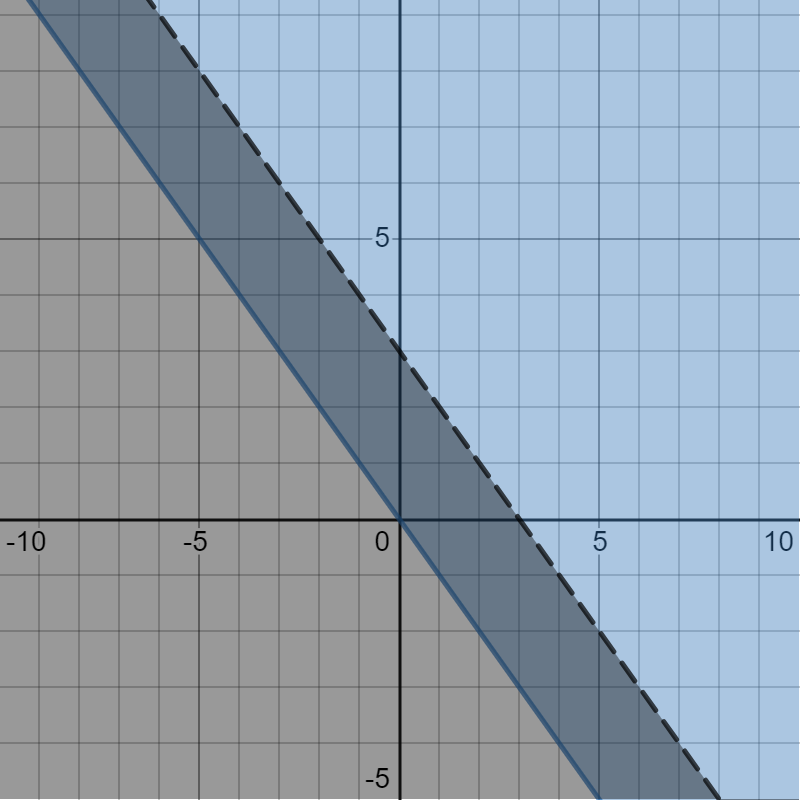
Two linear inequalities graphed on a coordinate plane where the shaded intersected regions are darker. One graph has a dashed line, a y-intercept of (0,3), a slope of -1 and is shaded below the boundary line. The other graph has a solid line, a y-intercept of (0,0), a slope of -1 and is shaded above the boundary line.
\( y \geq - x \)
\( y < - x + 3 \)
If you need help arriving at this answer, click the solution button.
| Step 1: Choose one inequality and write the equation of the boundary line. |
Start with the blue line that slopes up to the left. Its \(y\) -intercept is (0, 0). By counting, you can see the slope is \(m = \frac{1}{- 1} = - 1\). The equation of this boundary line is \(y = - x\). |
| Step 2: Determine which inequality symbol to use. |
The line is solid, so you will use either \(\leq\) or \(\geq\). Since the shading is on the top side of the line, use \(\geq\). This inequality is \(y \geq -x\). |
| Step 3: Repeat steps 1 and 2 for the second linear inequality. |
For the black line that slopes up to the left, the \(y\)-intercept is \((0,\ 3)\). By counting on the graph, the slope is \(m = \frac{1}{- 1} = - 1\). This is a dashed line with shading below, so use the symbol \(<\). This inequality is \(y < - x + 3\). |
| Step 4: Write the system of linear inequalities. |
\( y \geq - x \) \( y < - x + 3 \) |
Write the system of linear inequalities shown on this graph.
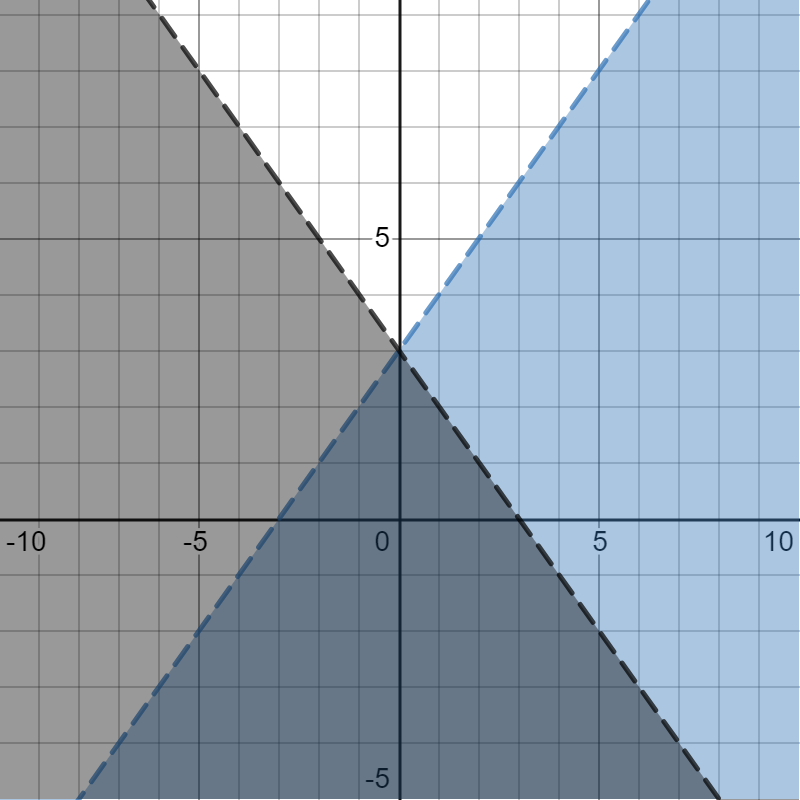
Two linear inequalities graphed on a coordinate plane where the shaded intersected regions are darker. One graph has a dashed line, a y-intercept of (0,3), a slope of 1 and is shaded below the boundary line. The other graph has a dashed line, a y-intercept of (0,3), a slope of -1 and is shaded below the boundary line.
\( y < x + 3 \)
\( y < - x + 3 \)
If you need help arriving at this answer, click the Solution button.
| Step 1: Choose one inequality and write the equation of the boundary line. |
Start with the blue line that slopes up to the right. Its \(y\) -intercept is (0, 3). By counting, you can see the slope is \(m = \frac{1}{1} = 1\). The equation of this boundary line is \(y = x + 3\). |
| Step 2: Determine which inequality symbol to use. |
The line is dashed, so you will use either < or >. Since the shading is below the line, use \(<\). This inequality is \(y < x + 3\). |
| Step 3: Repeat steps 1 and 2 for the second linear inequality. |
For the black line that slopes down to the right, the \(y\)-intercept is \((0,\ 3)\). By counting on the graph, the slope is \(m = \frac{1}{- 1} = - 1\). This is a dashed line with shading below, so use the symbol \(<\). This inequality is \(y < - x + 3\). |
| Step 4: Write the system of linear inequalities. |
\( y < x + 3 \) \( y < - x + 3 \) |
