Let's have a look...
The rate of change and initial value of a function can be determined using descriptions, tables, and graphs. This information can be used to create the linear function in the form \( y = mx + b \). For example:
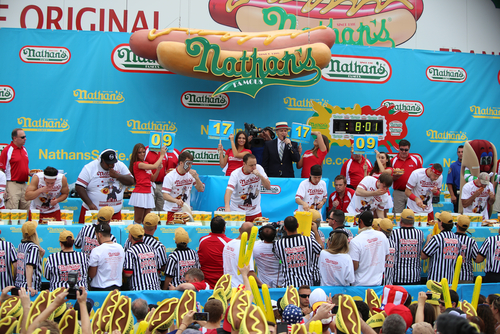
Every year, Nathan's holds a hot dog eating contest on Coney Island, New York. The table below represents the number of hot dogs eaten by one contestant as a function of time:
| Time, in mins |
Hot dogs eaten |
|---|---|
2 |
14 |
5 |
35 |
9 |
63 |
15 |
105 |
Construct the linear function that is represented in the table.
The steps for constructing a linear function from a table of values are shown in the table below. Click each step to see it applied to the example.
Choose any two ordered pairs from table to calculate the rate of change. Using \( (2, 14) \) and \( (9, 63) \): \( m = \frac{\left( 63 \right) - \left( 14 \right)}{\left( 9 \right) - \left( 2 \right)} \) \( m = \frac{49 \textsf{ hot dogs}}{7 \textsf{ mins}} \) \( m = \frac{7 \textsf{ hot dogs}}{1 \textsf{ min}} \) |
|
Substitute any ordered pair from the table, along with the rate of change \( m = 7 \), to solve for \( b \). Using \( (15, 105) \): \( (105) = 7(15) + b \) \( 105 = 105 + b \) \( 0 = b \) |
|
The value of \( m = 7 \) and \( b = 0. \) \( y = 7x \) |

Give it a shot!
Complete the activity below to practice constructing a linear function from a table of values. Answer the question on each tab, then check your answer.
The price of ice as a function of its weight is represented in the table below:

| Weight, in lbs. |
Total Cost ($) |
|---|---|
1.2 |
5.60 |
2.4 |
9.50 |
3.6 |
13.40 |
4.8 |
17.30 |
Construct the linear function to model the price of ice as a function of its weight.
\( y = 3.25x + 1.70 \)
If you need help arriving at this answer, click the Solution button.
Step 1: Determine the constant rate of change. |
Choose any two ordered pairs from table to calculate the rate of change. Using \( (1.2, 5.60) \) and \( (3.6, 13.40) \): \( m = \frac{\left( 13.40 \right) - \left( 5.60 \right)}{\left( 3.6 \right) - \left( 1.2 \right)} \) \( m = \frac{\$ 7.80}{2.4 \textsf{ lbs}} \) \( m = \frac{\$ 3.25}{1 \textsf{ lb}} \) |
Step 2. Solve for the initial value, \( b \). |
Substitute any ordered pair from the table, along with the rate of change \( m = 3.25 \), to solve for \( b \). Using \( (4.8, 17.30) \) \( (17.30) = 3.25(4.8) + b \) \( 17.30 = 15.60 + b \) \( \$1.70 = b \) |
Step 3: Write the function in \( y = mx + b \) form. |
The value of \( m = 3.25 \) and \( b = 1.70. \) \( y = 3.25x + 1.70 \) |
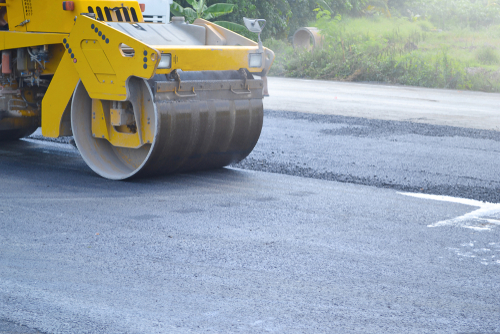
A construction company is paving the ground for a new parking lot. The table below represents the amount of square feet that remains to be paved as a function of time.
| Hours |
Sq. Ft. |
|---|---|
3 |
2958.5 |
6 |
2417.0 |
10 |
1695.0 |
13 |
1153.5 |
Construct the linear function which models the relationship in the table.
\( y = - 180.5x + 3500 \)
If you need help arriving at this answer, click the Solution button.
Step 1: Determine the constant rate of change. |
Choose any two ordered pairs from table to calculate the rate of change. Using \( (3, 2958.5) \) and \( (13, 1153.5) \): \( m = \frac{(1153.5) - (2958.5)}{(13) - (3) } \) \( m = \frac{- 1805.0\textsf{ ft}^{2}}{10 \textsf{ hrs}} \) \( m = \frac{- 180.5\textsf{ ft}^{2}}{1 \textsf{ hr}} \) |
Step 2. Solve for the initial value, \( b \). |
Substitute any ordered pair from the table, along with the rate of change \( m = - 180.5 \), to solve for \( b \). Using \( (10, 1695.0) \) \( (1695.0) = -180.5(10) + b \) \( 1695 = -1805 + b \) \( 3500 = b \) |
Step 3: Write the function in \( y = mx + b \) form. |
The value of \( m = - 180.5 \) and \( b = 3500. \) \( y = - 180.5x + 3500 \) |