Level Up
Are you ready to take this lesson's quiz? The questions below will help you find out. Make sure you understand why each answer is correct—if you do not, review that part of the lesson.
Which scenario can be modeled by the linear function \( y = \) 2\( x \ + \) 30?
- A carpet cleaning service charges $2 plus an additional $30 for every hour.
- A carpet cleaning service charges $30 plus an additional $2 for every hour.
- The population of emperor penguins in Antarctica is 30 and decreases by 2 each year.
- The population of emperor penguins in Antarctica is 2 and increases by 30 each year.
In the form \( y = \) m\( x \ + \) b, \( m \) represents the rate of change, and \( b \) represents the initial value.
For this scenario the initial value is $30 and the rate of change, \( m = \$ 2 \).
If a function has a decreasing rate of change, then the value of \( m \) will be negative.
In the form \( y = \) m\( x \ + \) b, the initial value is \( b \).
A 300 square foot wall must be painted. The crew is painting at a constant rate. After 10 minutes of painting, they have 240 square feet remaining to paint.
Which linear function can be used to model this situation?
- \( y = - \)4\( x \ + \) 240
- \( y = \) 6\( x \) \( - \)300
- \( y = - \)6\( x \ + \) 300
- \( y = - \)60\( x \ + \) 300
The input variable for this function is time, and the output variable is the number of square feet remaining to be painted. The initial value, \( b \), is the value of the \( y \)-intercept when \( x \) equals 0.
This function shows an initial value of \( b = - 300 \) and a rate of change that is increasing. Does that make sense for this scenario?
\((0,300)\) \( (10,240)\)
\((x_{1},y_{1})\text{ }(x_{2},y_{2}) \)
\(m= \frac{y_{2} - y_{1}}{x_{2} - x_{1}}= \frac{240 - 300}{10 - 0}=\frac{-60}{10} =-\frac{6\text{ ft}^2}{1\text{ min }} \)
Substitute the slope, -6, and the ordered pair (10,240) into the slope-intercept equation.
\(y = mx + b \)
\(240 = -6(10) + b \)
\(240 = -60 + b \)
\(300= b \)
This function shows an initial value of \( b = + 300 \). The rate of change indicates that the painting crew can complete their work at a rate of 60 square feet per minute. Does that make sense for this scenario?
Which linear function can be used to model the line on the graph?
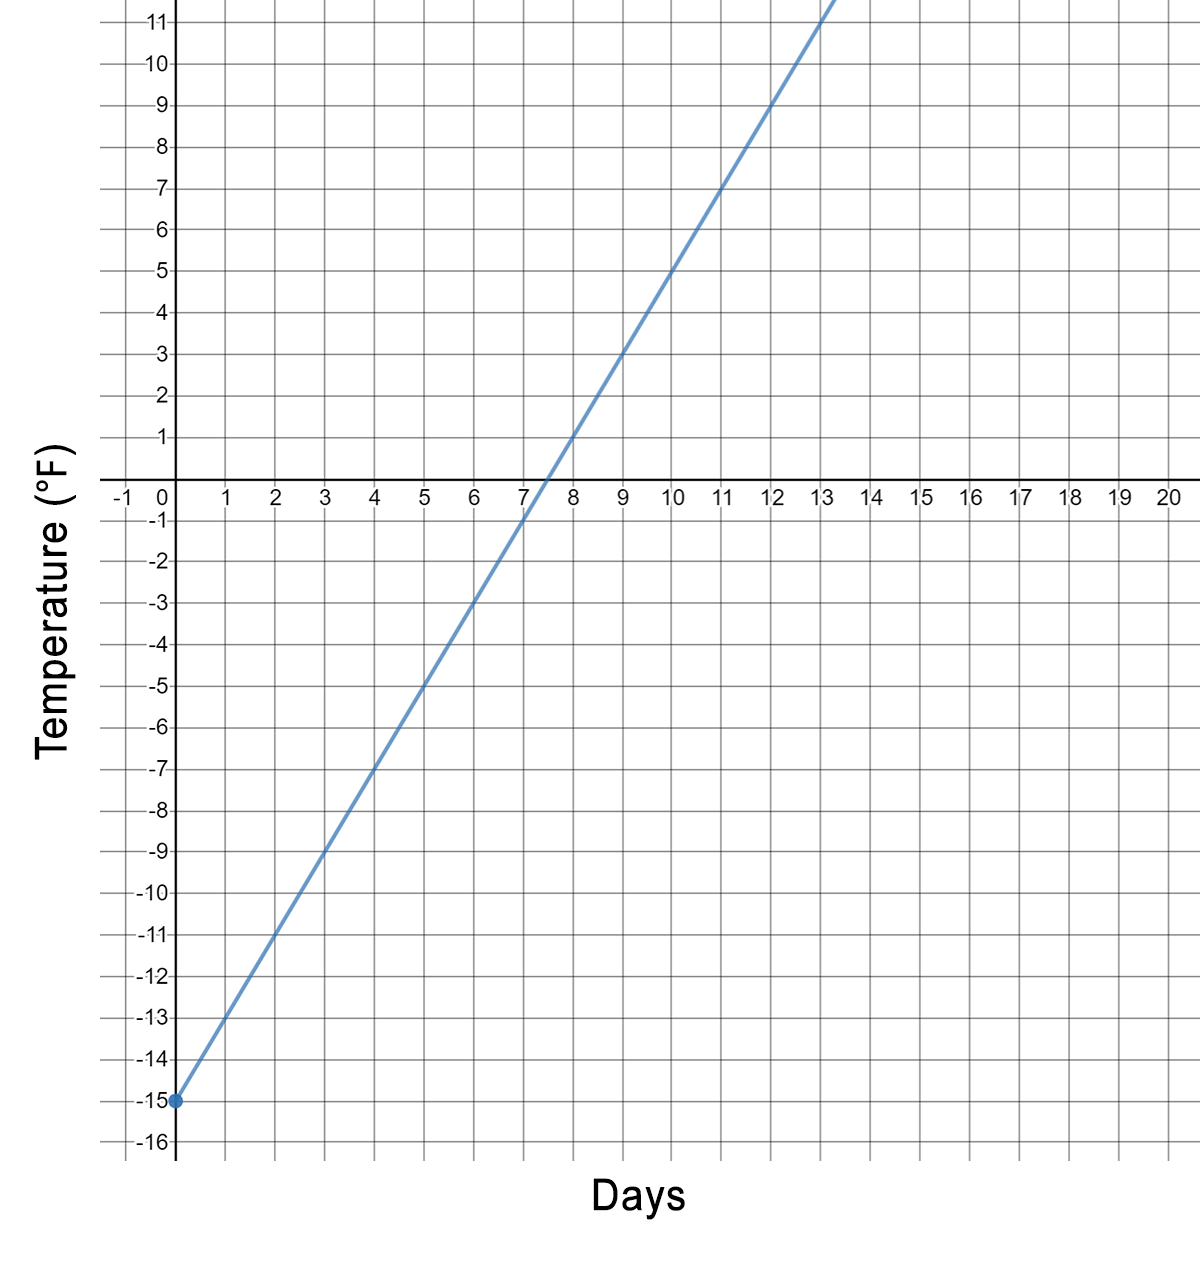
Graph representing the relationship between temperature in degrees Fahrenheit on the y-axis and days on the x-axis. Points on the line include (0, \( - \)15), (3, \( - \)9), and (10,5).
- \( y = \) 2\( x \) \( - \)15
- \( y = \) 2\( x \ + \) 15
- \( y = - \)2\( x \) \( - \)15
- \( y = - \)15\( x \ + \) 2
Use any two ordered pairs on the line to calculate the rate of change as \( + \)2 ℉ per day. You can read the initial value, \( - \)15 ℉, from the graph.
When reading the graph, the initial value is equal to the \( y \)-intercept. To find the rate of change, choose any two ordered pairs on the graph and calculate the rate of change using the slope formula. Substitute the values of \( m \) and \( b \) into the slope-intercept form of a linear function, \( y = mx + b \).
This graph shows a positive slope, so the rate of change cannot be negative.
The slope-intercept form a linear function is \( y = \) m\( x \ + \) b. Make sure you substitute your values correctly.
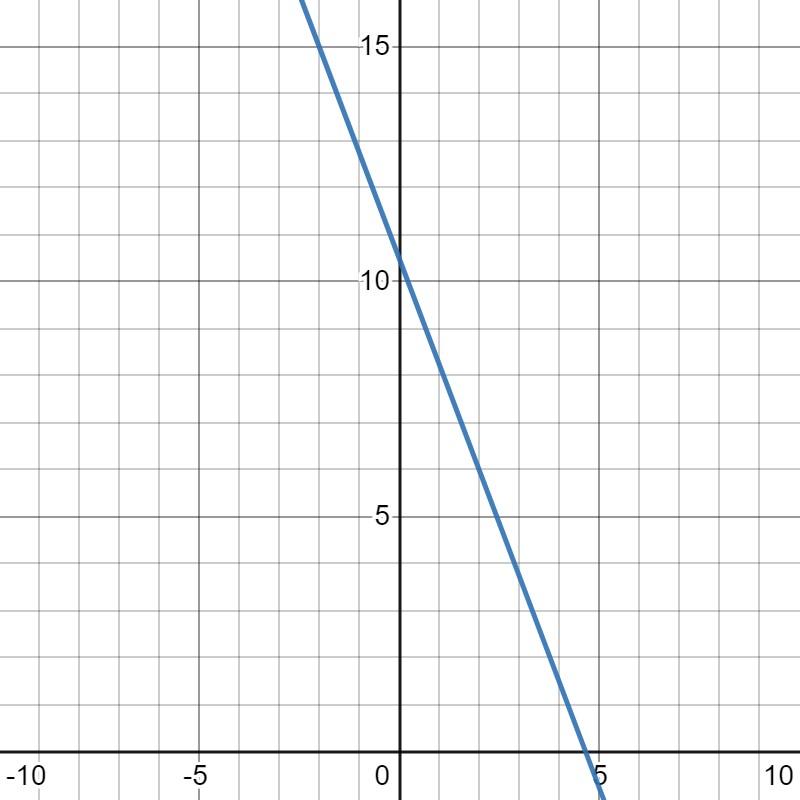
Which graph can be modeled by the linear function \( y = - 0.75x + 10.50 \)?
-
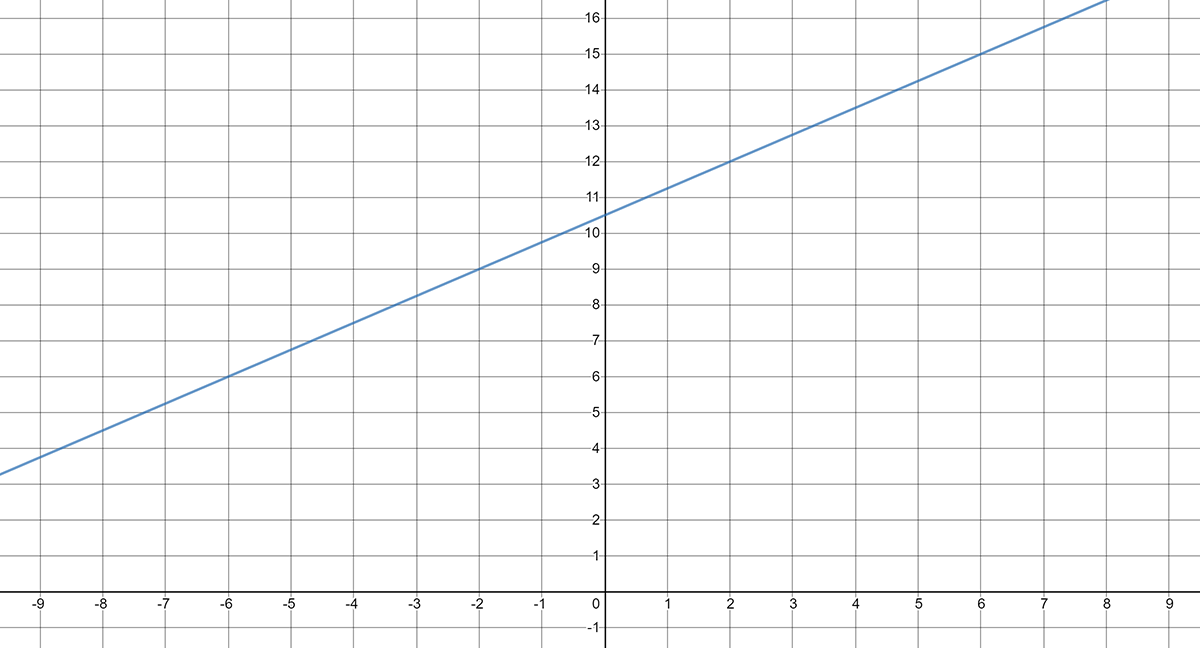
Graph of a line showing an increasing linear relationship between the two variables. The y-intercept is 10.5.
-
Graph of a line showing an increasing linear relationship between the two variables. The y-intercept is 0.
-
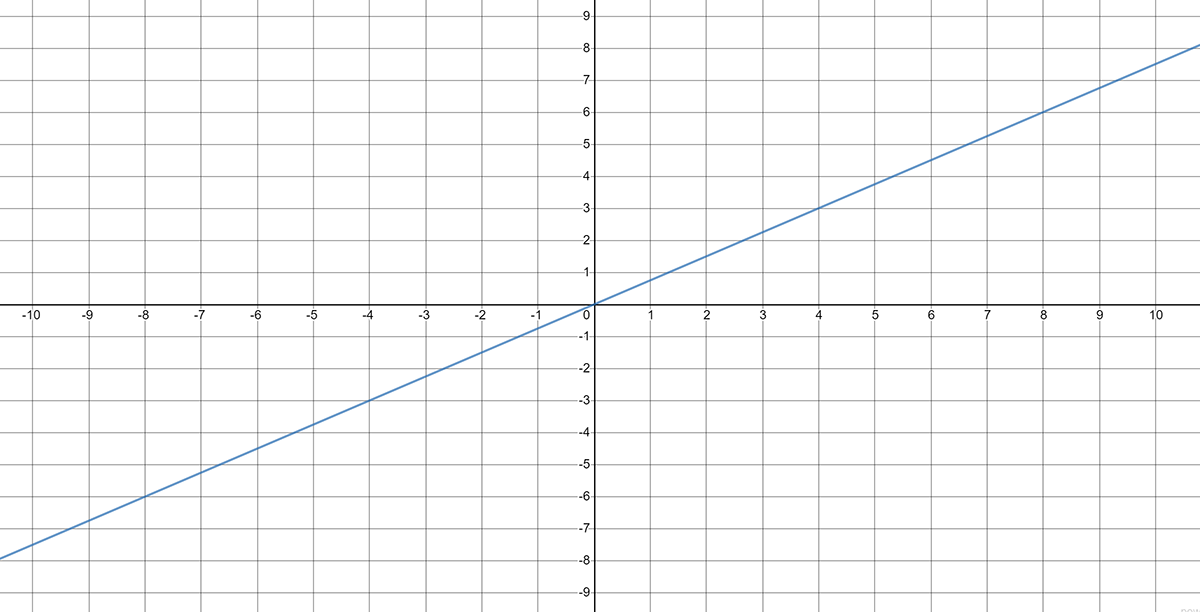
Graph of a line showing an increasing linear relationship between the two variables. The y-intercept is 0.
-
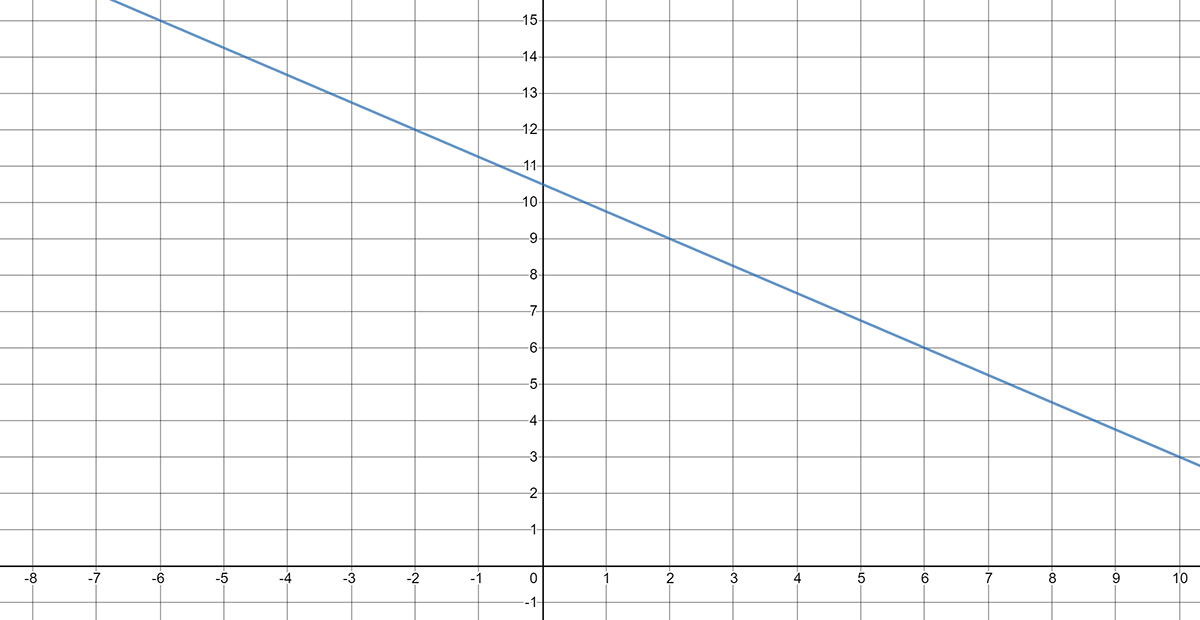
Graph of a line showing a decreasing linear relationship between the two variables. The y-intercept is 10.5.
The rate of change of the given function is negative. Does this graph show a line that has a negative rate of change?
The graph shows an initial value of 10.5. Does this graph show a rate of -0.75?
The given function shows an initial value of 10.5. Does this graph show a line with a \( y \)-intercept equal to 10.5?
The initial value show on this graph is 10.5. Choose any two ordered pairs on the line to calculate the rate of change, which is −0.75.
The total cost of a small pizza as a function of the number of toppings ordered is shown in the table below.
| Number of Toppings |
Total Cost ($) |
|---|---|
2 |
4.50 |
3 |
5.00 |
5 |
6.00 |
Which linear function models this scenario?
- \( y = \) \( x \ + \) 2.50
- \( y = \) 0.5\( x \ + \) 3.50
- \( y = \) 2\( x \ + \) 0.50
- \( y = \) 0.25\( x \ + \) 3.00
Use any two ordered pairs in the table to calculate the rate of change as \( m = \frac{\textsf{Change in } y \textsf{ (total cost)}}{\textsf{Change in } x \textsf{ (toppings)}} = \frac{y_{2} - y_{1}}{x_{2} - x_{2}}. \) Once you calculate \( m \), substitute that value, along with any ordered pair from the table, into \( y = mx + b \). Then solve for \( b \) and write the function.
Calculate the rate of change as \( m = \frac{\left( 5 \right) - \left( 4.50 \right)}{\left( 3 \right) - \left( 2 \right)} = \$ 0.50. \) Substitute this value along with any ordered pair from the table to determine the initial value is $3.50.
\(y = mx + b\)
\(4.50 = 0.50(2) + b\)
\(4.50 = 1 + b\)
\(3.50= b\)
Use any two ordered pairs in the table to calculate the rate of change as \( m = \frac{\textsf{Change in } y \textsf{ (total cost)}}{\textsf{Change in } x \textsf{ (toppings)}} = \frac{y_{2} - y_{1}}{x_{2} - x_{2}}. \) Once you calculate \( m \), substitute that value along with any ordered pair from the table into \( y = mx + b \). Then, solve for \( b \) and write the function.
Use any two ordered pairs in the table to calculate the rate of change as \( m = \frac{\textsf{Change in } y \textsf{ (total cost)}}{\textsf{Change in } x \textsf{ (toppings)}} = \frac{y_{2} - y_{1}}{x_{2} - x_{2}}. \) Once you calculate \( m \), substitute that value along with any ordered pair from the table into \( y = mx + b \). Then, solve for \( b \) and write the function.
Which table represents the linear function \( y = - \)12.5\( x \ + \) 200?
-
\( x \)
\( y \)
−1
212.5
0
202.5
1
187.5
2
165.5
-
\( x \)
\( y \)
−1
201.5
0
200.0
1
197.5
2
170.0
-
\( x \)
\( y \)
−1
212.5
0
200.0
1
187.5
2
175.0
-
\( x \)
\( y \)
−1
198.5
0
205.0
1
178.5
2
165.0
The initial value in the given function is \( b = 200 \). Does the table show a value of \( y = 200 \) when \( x = 0 \)?
This table shows the correct initial value. Use any two ordered pairs from the table to determine if the rate of change is \( m = - 12.5. \)
Read the initial value from the table as \( b = 200 \). Choose any two ordered pairs from the table to calculate the rate of change as \( m = \frac{\left( 200 \right) - (175)}{\left( 0 \right) - (2)} = \frac{25}{- 2} = - 12.5 \).
\(y = mx + b\)
\(187.5 = -12.5(1) + b\)
\(187.5 = -12.5 + b\)
\(200= b\)
The initial value in the given function is \( b = 200 \). Does the table show a value of \( y = 200 \) when \( x = 0 \)?
Summary
Questions answered correctly:
Questions answered incorrectly: