Let's Practice
In the video on the previous page, you learned how to use the graph of a line to construct its function. Now, it's your turn to use what you have learned in the video to construct your own linear functions.
Practice constructing a linear function from a graph by completing the activity below.
Construct the linear function that represents the line in the graph on each tab. Remember that you should use the graph to solve for both the rate of change and the initial value of the function. Be sure to check your answers.
The graph below represents the total cost of a bag of cherries as a function of weight (in ounces).

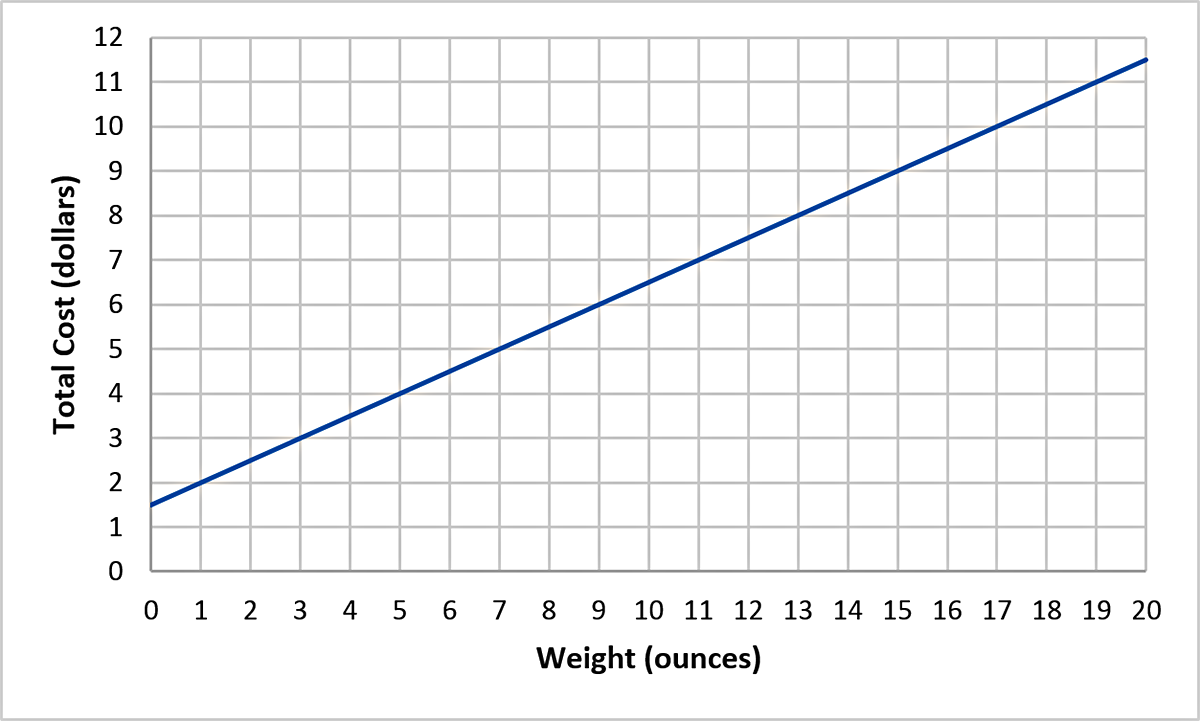
Graph representing the relationship between total cost in dollars on the y-axis and weight in ounces on the x-axis. Points on the line include (0, 1.5), (3, 3), and (13,8).
Construct the linear function that is used to model this graph.
\( y = 0.5x + 1.5 \)
If you need help arriving at this answer, click the Solution button.
Step 1: Determine the constant rate of change. |
Choose any two ordered pairs that lie along the line. Using (3, 3) and (13, 8): \( m = \frac{(8) - (3)}{(13) - (3) } \) \( m = \frac{\$ 5}{10 \textsf{ ounces}} \) \( m = \frac{\$ 0.5}{1 \textsf{ ounce}} \) |
Step 2. Solve for the initial value, \( b \). |
Substitue the slope, 0.5, and the ordered pair (3,3) into the slope-intercept equation.
|
Step 3: Write the function in \( y = mx + b \) form. |
The value of \( m = 0.5 \) and \( b = 1.5 \) \( y = 0.5x + 1.5 \) |
The graph represents the temperature of a certain location over a period of days.

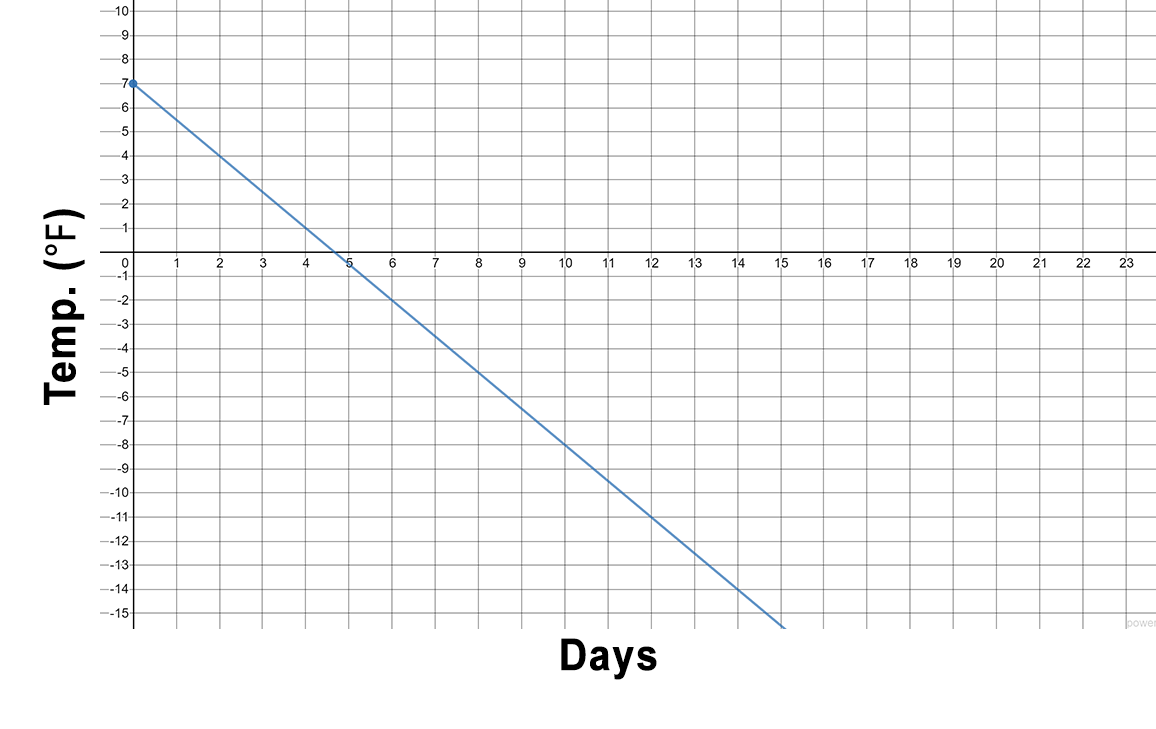
Graph representing the relationship between temperature in degrees Fahrenheit on the y-axis and days on the x-axis. Points on the line include (0, 7), (2, 4), and (4,1).
Construct the linear function that is shown on the graph.
\( y = - \frac{3}{2}x + 7 \)
If you need help arriving at this answer, click the Solution button.
Step 1: Determine the constant rate of change. |
Choose any two ordered pairs that lie along the line. Using (0, 7) and (4, 1): \( m = \frac{(1) - (7)}{(4) - (0) } \) \( m = \frac{- 6\ ^{\circ}\textsf{F}}{4 \textsf{ days}} \) \( m = \frac{- 3 \ ^{\circ}\textsf{F}}{2 \textsf{ days}} \) |
Step 2. Solve for the initial value, \( b \). |
Read the value of the \( y \)-intercept from the graph. It is (0, 7). |
Step 3: Write the function in \( y = mx + b \) form. |
The value of \( m = - \frac{3}{2} \) and \( b = 7. \) \( y = \frac{3}{2}x + 7 \) |