Create and Analyze Bar Graphs
Let’s watch a video about analyzing data to create a bar graph.
Goal:
Goal:

Learn!
Goal: Analyze data to create a bar graph.
Dot the Robot wants to take us on a tour of her after-school programs. Her students are always excited by the fun activities that she plans. Let’s learn how to create a bar graph that shows the activities she organizes after school!
![]()
School’s out for the day! Hooray! Dot the Robot wants to show you her after-school activities. She has many fun clubs that the city students participate in each day of the school week.
Let’s gather data about Dot’s after-school activities and make a bar graph!
Our first day with Dot the Robot is on Monday.
What’s that, Dot?
That’s right! Our after-school activity today is music club!
Let’s find out how many students are in Dot’s music class.
Dot gives that a green check for correct!
There are 3 students in Dot’s music class!
Let’s put our data in a chart. There are 3 students total and 3 tally marks.
We are going to continue to the next day of the week. Do you know what day comes after Monday?
That’s right! It’s Tuesday!
On Tuesday Dot has her soccer club.
What’s that, Dot?
Dot wants you to know she loooooves soccer!
Can you count how many kids are in the soccer club? You got it! There are 4 soccer players total so we need 4 tally marks.
What comes after Tuesday? Super! We are going to look at Dot’s after-school activities on Wednesday.
Wednesday Dot has her book club.
What’s that, Dot?
Dot wants you to know she is an amazing reader!
Can you count how many kids are in the book club? Nice work! There are 9 readers total so we need 9 tally marks.
Remember, to make 9 tally marks, we first make 5 by making 4 tally marks and then a slash to show 5. Then we add 4 more tally marks for a total of 9.
We have our Wednesday data. Let’s go to the next day of the week? Do you know what day comes after Wednesday?
That’s right! It’s Thursday!
On Thursday Dot the Robot has her swim club!
What’s that, Dot?
Dot wants you to know the kids have so much fun in the swim club!
Can you count how many kids are in the swim club? Fantastic! There are 5 swimmers total so we need 5 tally marks. One, two, three, four tally marks and a slash.
Let’s get to our last day of the school week. Do you know the day after Thursday? Oh, yeah, it’s Friday!
On Friday Dot has her fishing club.
What’s that, Dot?
Dot has a joke for you!
What do you call a fish with lots of money? A goldfish!
Let’s get back to business and count how many students are in the fishing club.
There are 3 students in the fishing club. Nice catch!
Now we have all of our data. Let’s make a bar graph!
What’s that, Dot?
That’s right! Dot wants to remind us that we must follow all of the steps to create a graph.
Step One: Gather the data. Check! We have all of the data.
Step Two: Add a Title. The title of our graph is After-School Activities with Dot the Robot.
Step Three: Add the scale. Let’s add the numbers to our graph to keep count of how many students are in each club.
Step Four: Add labels. We have labels for each day of the week and each after-school activity.
Step Five: Graph the data.
What’s that, Dot?
Hurry up? OK, OK. We are ready.
Remember that each student is represented by a bar on the graph. The bar is colored in up to the total amount of specific data collected. Let’s add our data to the graph.
There are three students in the music club.
There are four students in the soccer club.
There are nine students in the book club.
There are five students in the swim club.
And there are three students in the fishing club.
Excellent! We have our bar graph!
What’s that, Dot?
Oh, right, now we need to analyze our bar graph!
Are you ready? It’s time for a quiz.
Let’s look at our graph. It shows a nice picture of all of our data.
Question 1: Which after-school activity has the most students?
We can look for the largest bar, which is 9 students. The book club has the most students!
Question 2: Which after-school activity has the fewest number of students?
This can be tricky. There are actually two after-school clubs that have the same number of students. The music club and the fishing club both have three students. These two clubs have the fewest number of students.
Wow, you are really good at analyzing data.
Let’s try a challenge question.
Question 3: How many students participate in after-school activities for the entire week?
Look closely at the bar graph, and take your time to figure this out.
Hooray! You calculated correctly. We can add the number of students who participate in all of the activities each day to get the total for the entire week.
Three students go to music club on Monday, plus four soccer club students on Tuesday, plus nine book club students on Wednesday, plus 5 swim club students on Thursday, plus three fishing club students on Friday.
A total of 24 students attend Dot’s after-school activities each week. Impressive bar graph skills!
What’s that, Dot?
Dot the Robot wants you to know that she thinks you are an expert at creating and analyzing bar graphs!
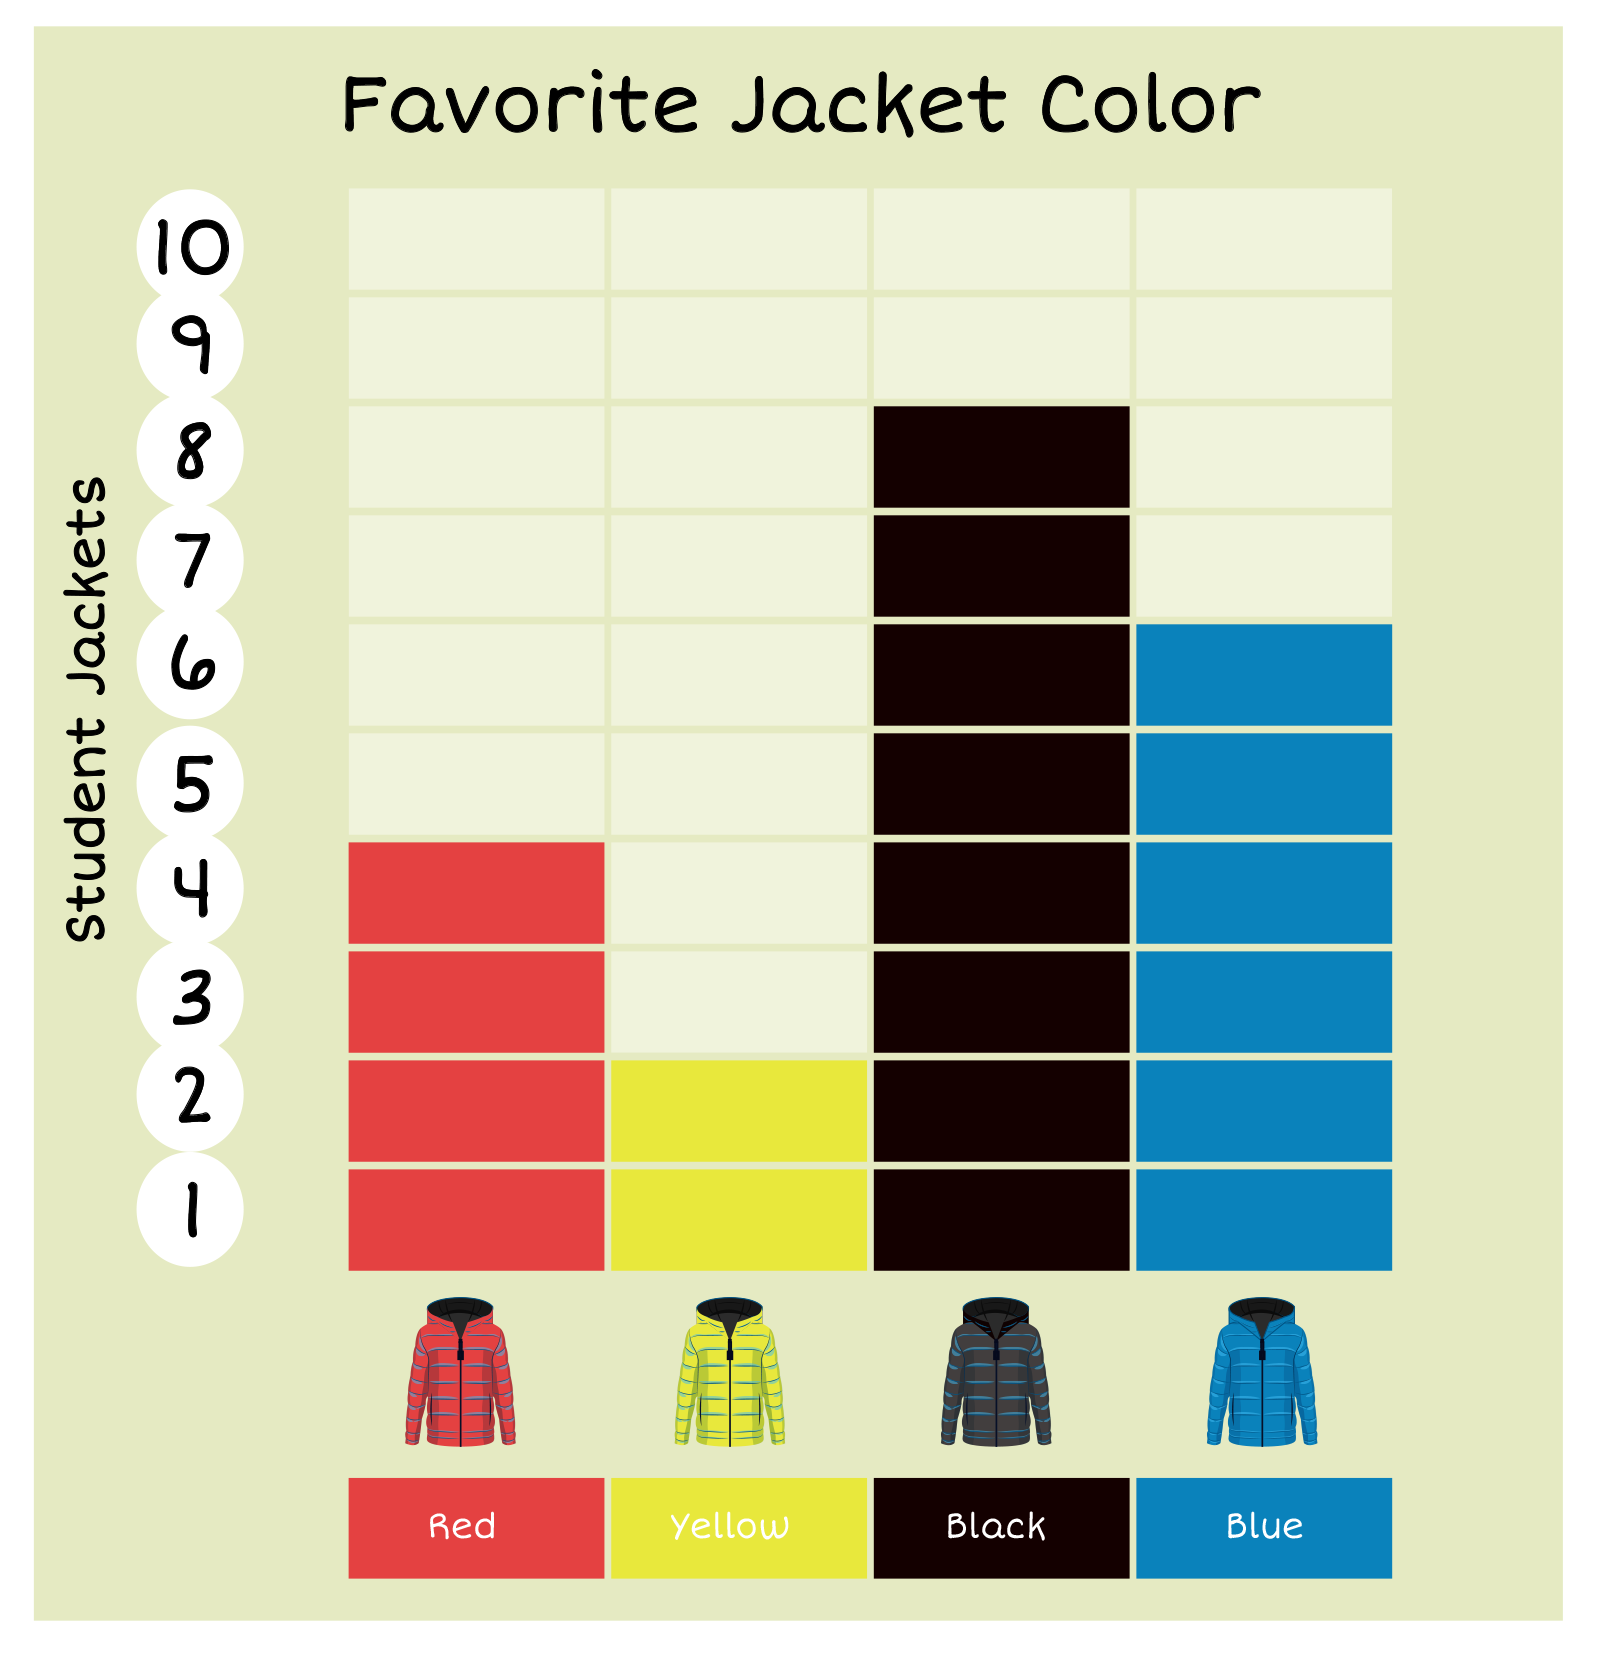
Let’s look at the jackets the students are wearing and analyze the data! Read each question and click the box to find the answer. Use the following bar graph to answer the questions.