Let’s Practice!
Can you answer questions about data displayed on a line graph?
Goal:
Goal:

You Can Do It!
Goal: Interpret a line graph to answer questions.
A line graph is a graph that organizes and compares how data changes over time.

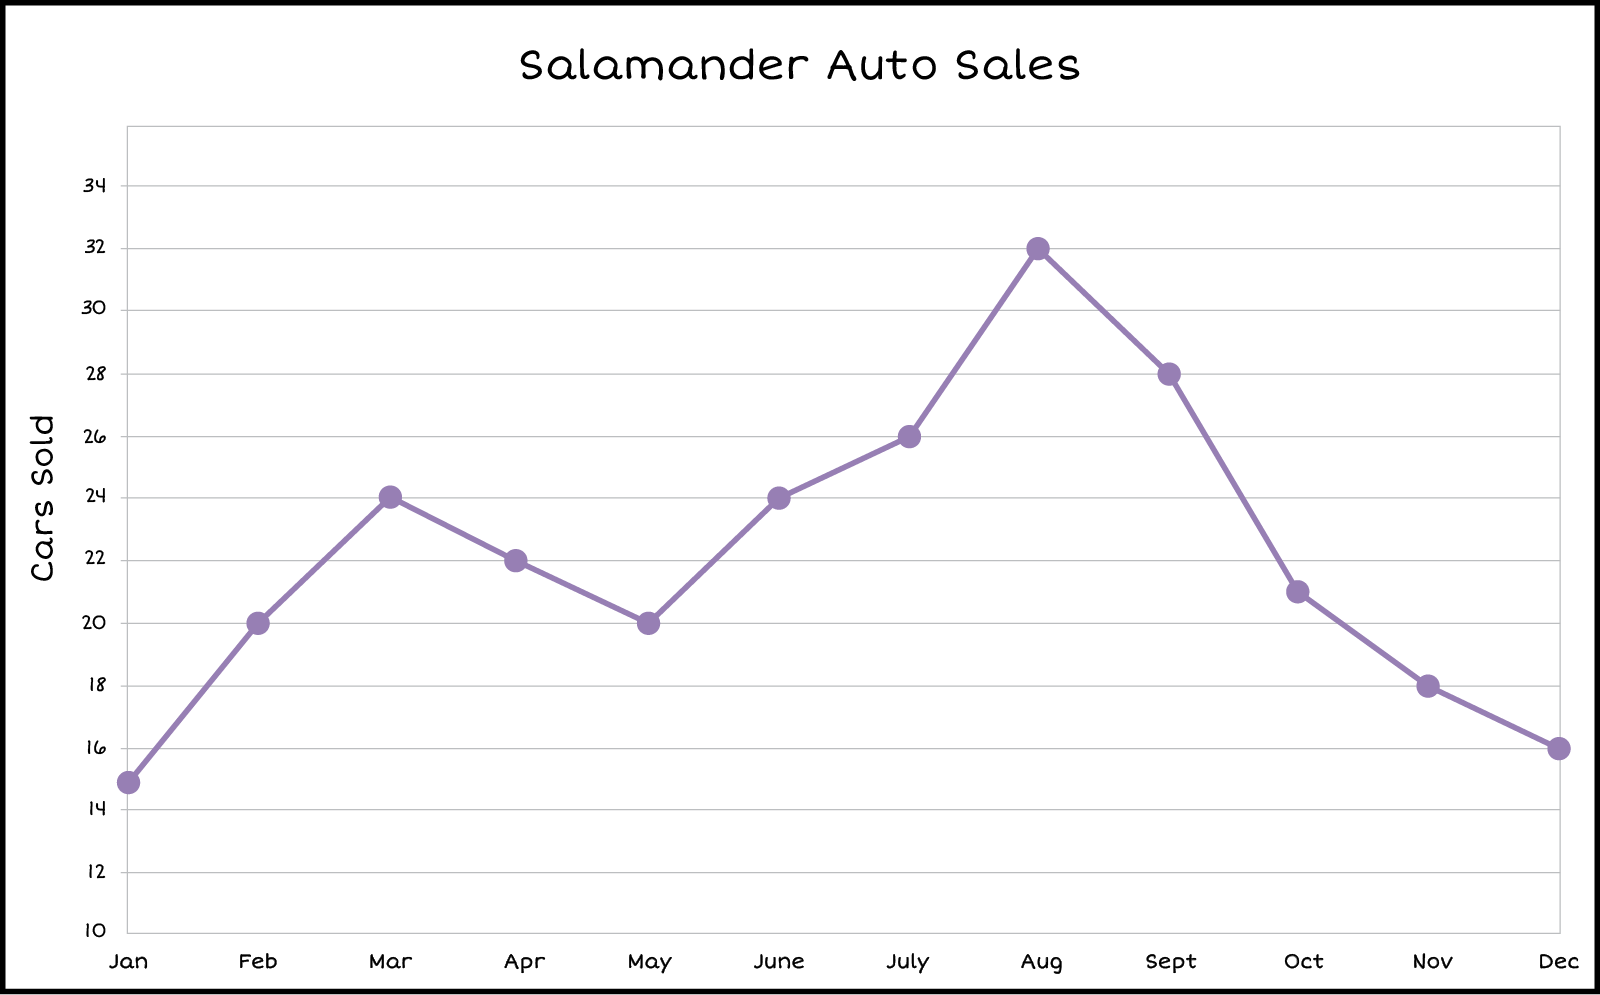 >Line Graph: Title: Salamander Auto Sales, Vertical
Label/Scale: Cars Sold
10,12,14,16,18,20,22,24,26,28,30,32,34. Horizontal Labels
January, February, March, April, May, June, July, August,
September, October, November, December. Line and Plots:
January 15, February 20, March 24, April 22, May 20, June
24, July 26, August 32, September 28, October 21, November
18, December 16.
>Line Graph: Title: Salamander Auto Sales, Vertical
Label/Scale: Cars Sold
10,12,14,16,18,20,22,24,26,28,30,32,34. Horizontal Labels
January, February, March, April, May, June, July, August,
September, October, November, December. Line and Plots:
January 15, February 20, March 24, April 22, May 20, June
24, July 26, August 32, September 28, October 21, November
18, December 16.
What is this line graph recording?
the number of cars sold by Salamander Auto over the year
How many cars were sold in July?
- 26 cars
- 24 cars
- 18 cars
Correct! In July, 26 cars were sold.
Look at the dot above July. Which number is it across from?
Look at the dot above July. Which number is it across from?
How many months had more than 25 cars sold?
- 5 months
- 6 months
- 3 months
- 4 months
In July, August and September, more than 25 cars were sold.
In July, August and September, more than 25 cars were sold.
Correct! In July, August and September, more than 25 cars were sold.
In July, August and September, more than 25 cars were sold.
Which month has the MOST sales?
- September
- August
- July
- March
Look for the month label with the highest number above it.
Correct! August is the month with the most sales.
Look for the month label with the highest number above it.
Look for the month label with the highest number above it.
Which months had 20 sales? Choose all correct answers.
- February
- March
- April
- May
- October
Look for the month labels that have the same number above them.
Look for the month labels that have the same number above them.
Correct! Febuary and May the same number of sales as each other.
Which month had the LEAST sales?
- January
- February
- November
- December
Correct! January had the least amount of sales.
Look for the month label with the lowest number above it.
Look for the month label with the lowest number above it.
Look for the month label with the lowest number above it.
Summary
Questions answered correctly:
Questions answered incorrectly: