Problem Solving
How do you use what you have learned to solve problems?
Goal:
Goal:

Practice!
Goal: Apply what you have learned about reading line graphs to solve word problems.
As the project manager makes his final decision on when to start the school's construction project, he looks at the cost of materials as well. The line graph below shows the average cost of wood over the last eight months. Let's figure out what the best time is to buy wood.
Word Problem Solving Steps
- Read the problem.
- Look for important information.
- Read the line graph.
- Solve using the data.

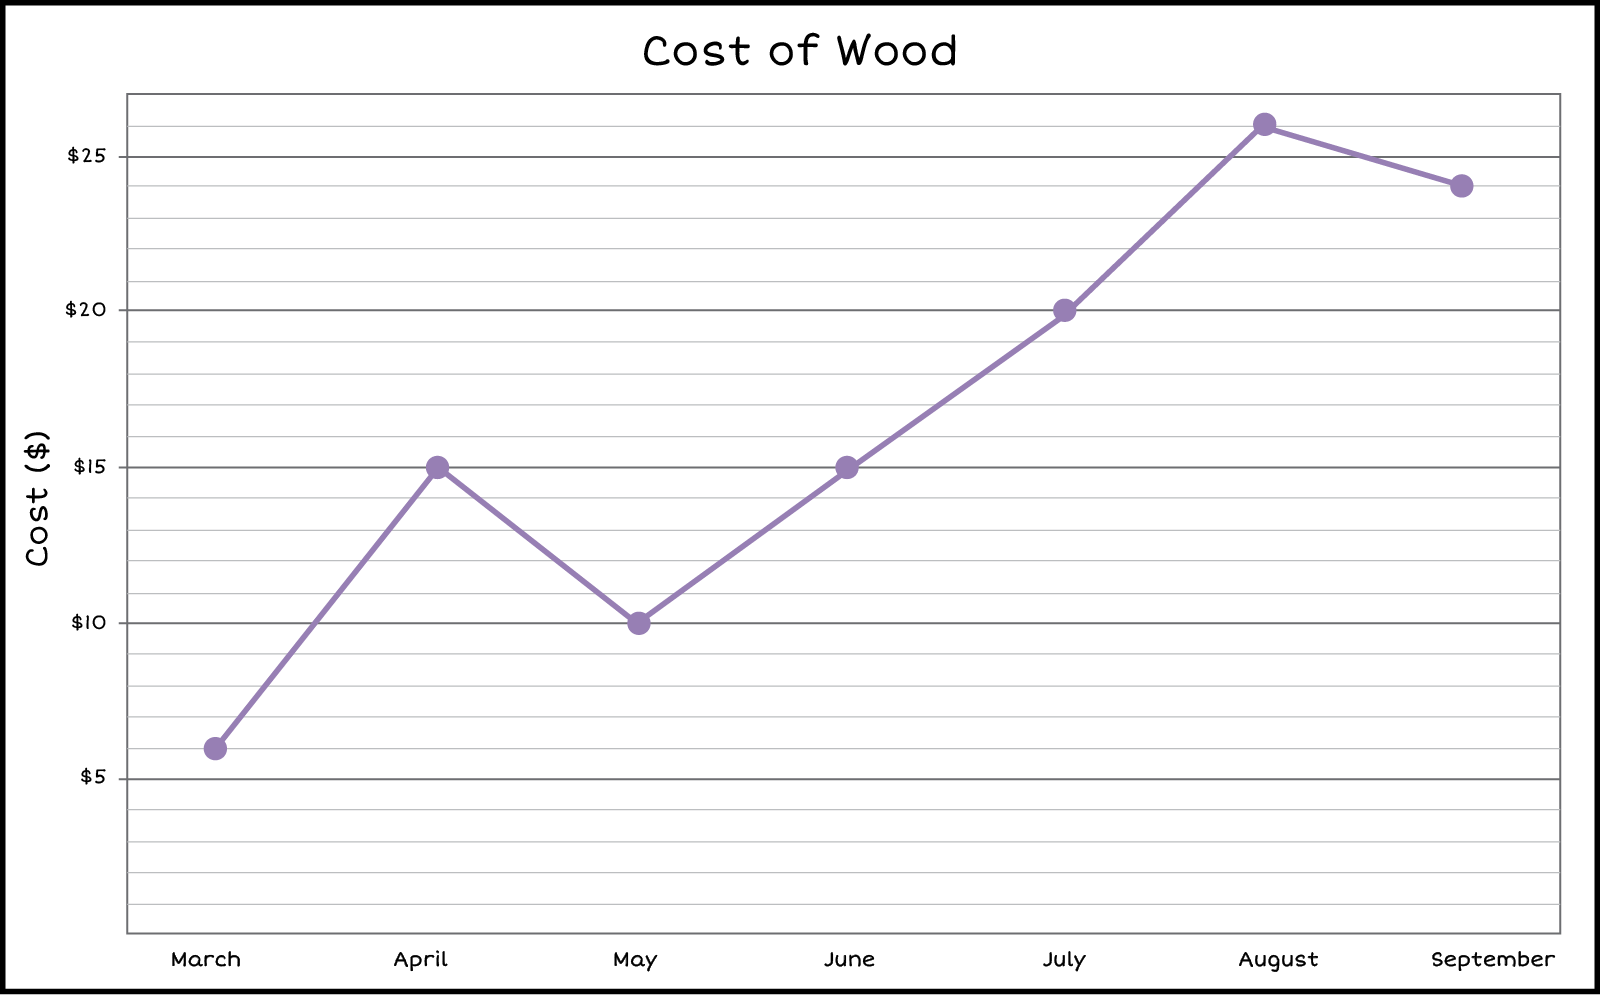 Line Graph: Title: Cost of Wood, Vertical Label/Scale: Cost
0,5,10,15,20,25. Dollars. Horizontal Labels March, April, May,
June, July, August, September. Line and Plots: March 6 Dollars,
April 15 Dollars, May 10 Dollars, June 15 Dollars, July 20
Dollars, August 26 Dollars, September 24 Dollars.
Line Graph: Title: Cost of Wood, Vertical Label/Scale: Cost
0,5,10,15,20,25. Dollars. Horizontal Labels March, April, May,
June, July, August, September. Line and Plots: March 6 Dollars,
April 15 Dollars, May 10 Dollars, June 15 Dollars, July 20
Dollars, August 26 Dollars, September 24 Dollars.
Correct!
Oops, try again.
Question
What is the best month to buy the wood for this project?
March is the best month to buy wood at the lowest cost.
Great job! We will continue to learn more about line graphs.