Assess Yourself
How well do you understand the ideas in this lesson?
Goal:
Goal:

Show What You Know!
Are you ready to take this lesson's quiz? These questions will help you find out. Go back to the lesson if you do not know an answer.
A line graph is...
- a graph that tells how many lines are in a drawing.
- a graph that shows how many people are in our class.
- a graph that displays how many times the item is picked.
- a graph that organizes and compares how data changes over time
No, a line graph does not tell us how many lines are in a drawing
Incorrect. A line graph shows how data changes over time
Try again. A line graph must also include how that has changed over time.
Yes! A line graph uses points to show how often something happens or changes over time.
What is data?
- information collected by asking questions
- the amount of information that can fit on a graph.
- the number of Xs on a graph.
Yes. Data is information that is collected by asking questions or observing how often something occurs
Try again. You can have more information than can fit on a graph.
Try again. The Xs in a line plot record the frequency of each item; data tells you what that X represents.
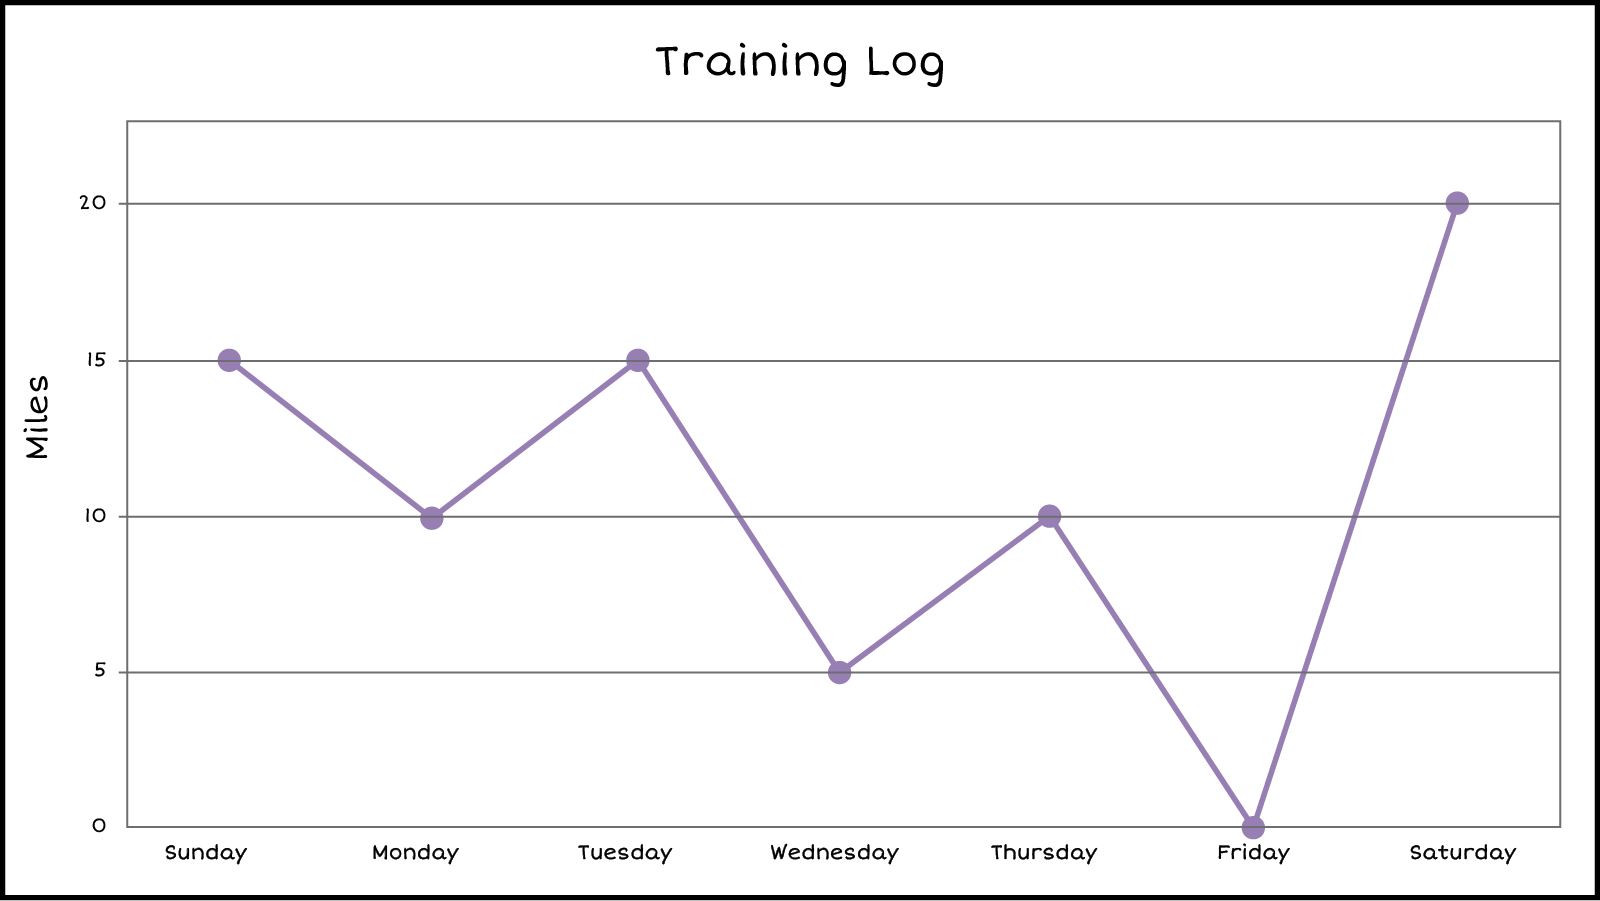
What is this line graph recording?
-
the number of hours the student trains each day
- the number of pushups the student completes
- the number of miles that are in the town
- the number of miles this student runs each day during the week
Try again. Training 20 hours in one day would be too much.
Try again. Push-ups are not listed on this graph. Look at the labels to identify the correct unit that is being measured.
Try again. While some towns may have 20 miles, it is not related to this graph.
Yes. The labels “miles” and “days of the week” help to guide you to this conclusion.
The line graph shows the training log of a student. On which day did the student NOT train?
-
Monday
-
Tuesday
-
Friday
-
Saturday
Try again. Look at the number of miles listed for Monday. Some training is happening this day.
Try again. You are looking for the day without any training.
Yes. On this day, zero miles were completed, which means no training occurred.
Try again. Look at the number of miles listed for Saturday. Training is happening on this day.
On which day did the student complete the MOST miles?
-
Wednesday
-
Friday
-
Saturday
-
Sunday
Try again. 5 miles were completed on this day; more miles were completed on other days
Try again. On this day, no miles were completed.
That is correct! On this day, 20 miles were completed, more than any other day in this week.
Try again. 15 miles were completed on this day; more miles were complete on another day.
On how many days did the student complete fewer than 10 miles?
-
2 days
-
1 day
-
3 days
-
4 days
Correct. On Wednesday 5 miles were completed, and on Friday 0 miles were completed.
Try again. All values below 10 would count as less than. Did you check all the days of the week?.
Try again. Make sure you are looking at the values less than 10, not greater than 10.
Try again. This is asking for the number of days the student trained fewer than 10 miles.
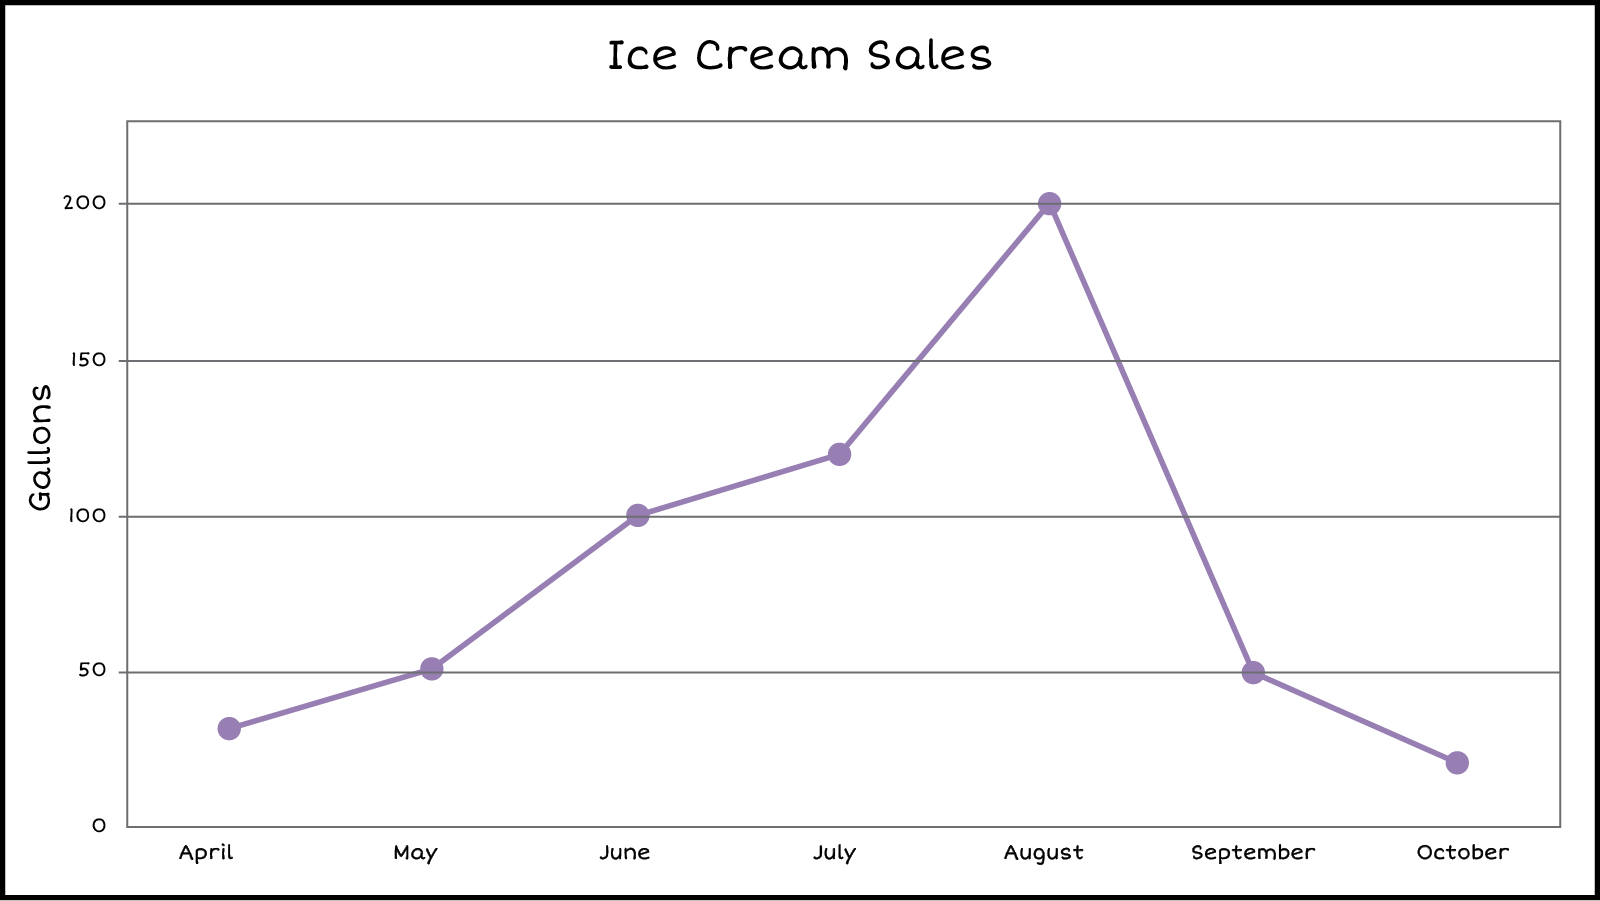
This graph charts the ice cream sales at Kevin's Sweet Shop. Which month had the MOST sales?
-
August
-
April
-
July
-
June
Great job! This month had the most sales.
Try again. In this month, the sales were very low.
Try again. While this month had more sales than the month before, it did not have the most.
Try again. While this month had more sales than the month before, it did not have the most.
In which months were the same number of gallons sold?
-
May and September
-
April and October
-
August and October
-
April and May
Yes. The sales are 50 gallons in both months.
Try again. These sales are close in value, but not the same.
Try again. These are the months with the most and least number of gallons sold.
Try again. These months are in a row, but they do not have the same value of sales.
In which months were more than 90 gallons sold?
-
June, July, and August
-
April and May
-
September and October
-
April and October
Correct. June had 100 gallons, July had 120 gallons, and August had 200 gallons sold.
Try again. These months did not have more than 90 gallons sold. April had 30 gallons sold, and May had 50 gallons sold.
Try again. These months did not have more than 90 gallons sold. September had 50 gallons sold, and October had 20 gallons sold.
Try again. These were the months with the lowest sales
What reason may explain the change in the sales from August to September?
-
More people were buying ice cream.
-
The weather got cooler.
-
The weather got warmer.
-
More people came into the area.
Try again. The number of gallons sold decreased from August to September.
Yes! As the temperature decreases, so do ice cream sales.
Try again. When the weather gets warmer, the sales would increase; however, sales decreased from August to September
Try again. More people in the area usually increases sales; however, there was a decrease in sales.
Summary
Questions answered correctly:
Questions answered incorrectly: