Let’s Learn!
How can I compare and analyze data on a line graph?
Goal:
Goal:

Think About It!
Goal: Compare and analyze data displayed on a line graph.
As the construction workers get ready, the project manager is looking at his line graphs. To know the best time to start, we will use a line graph!
A line graph is a graph that organizes and compares how data changes over time.
Data is information collected by asking questions or observing how often something occurs.
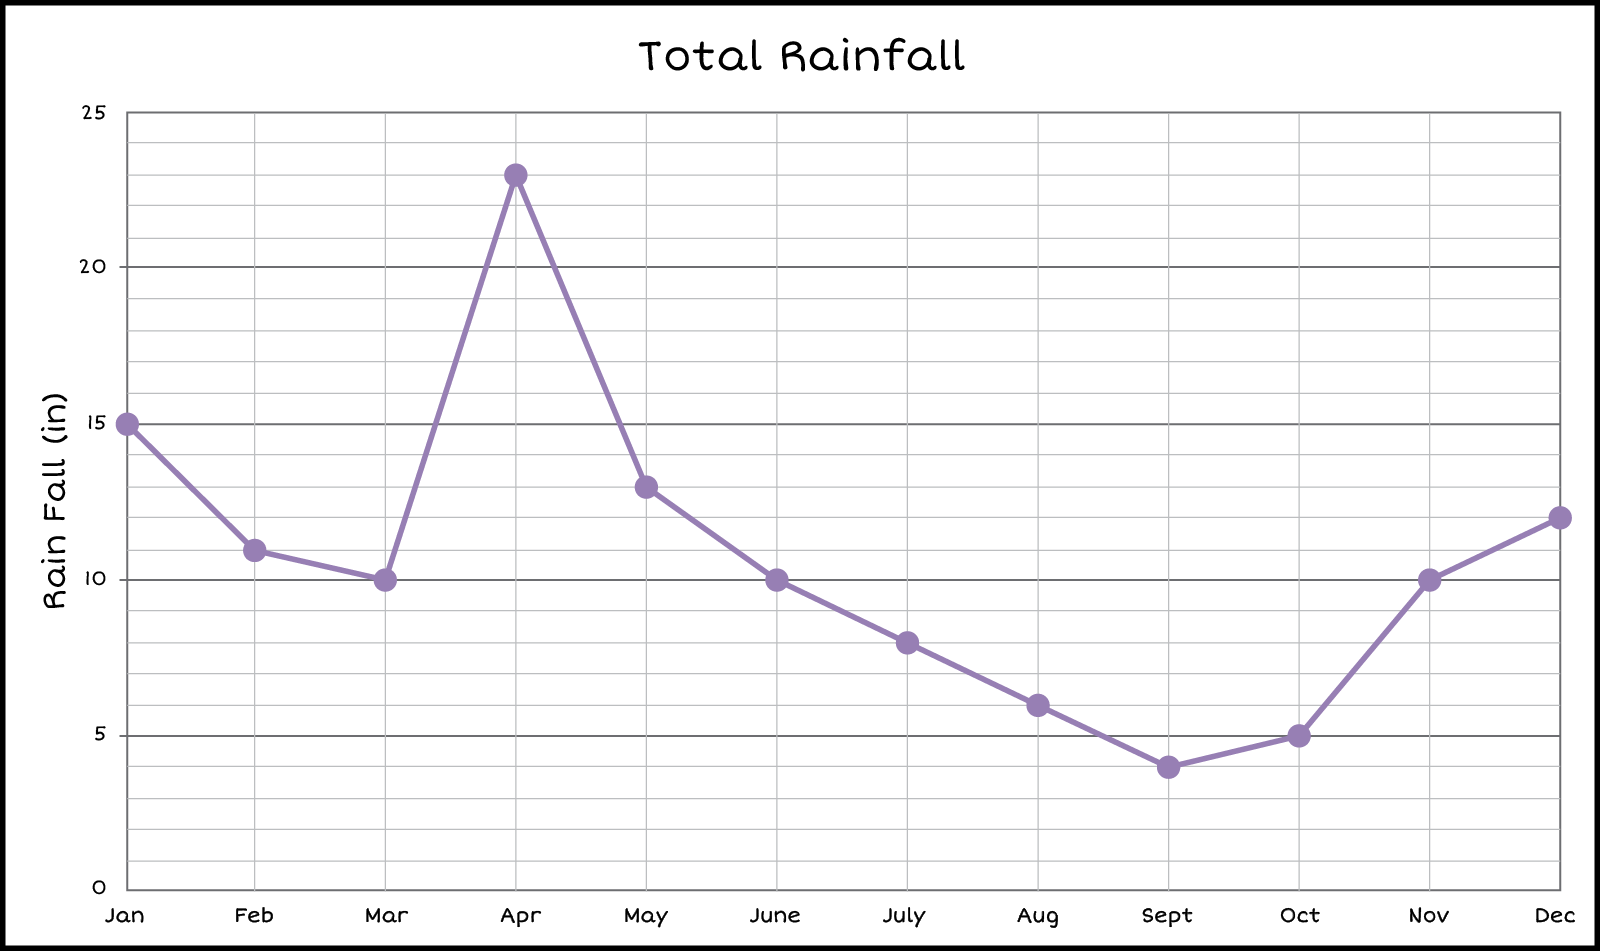 Line Graph: Title: Total Rainfall, Vertical Label/Scale: Rain
0,5,10,15,20,25. fall inches. Horizontal Labels January,
February, March, April, May, June, July, August, September,
October, November, December. Line and Plots: January 15,
February 11, March 10, April 23, May 13, June 10, July 8, August
6, September 4, October 5, November 10, December 12.
Line Graph: Title: Total Rainfall, Vertical Label/Scale: Rain
0,5,10,15,20,25. fall inches. Horizontal Labels January,
February, March, April, May, June, July, August, September,
October, November, December. Line and Plots: January 15,
February 11, March 10, April 23, May 13, June 10, July 8, August
6, September 4, October 5, November 10, December 12.
Look at this line graph tracking the amount of rainfall for the months of the year. The workers will not be able to work if there is too much rain. But how much rain is too much?
Click through the slides below to see how to use a line graph to answer questions based on the data that has been collected.
Line Graph: Title: Total Rainfall, Vertical Label/Scale: Rain
0,5,10,15,20,25. fall inches. Horizontal Labels January,
February, March, April, May, June, July, August, September,
October, November, December. Line and Plots: January 15,
February 11, March 10, April 23, May 13, June 10, July 8, August
6, September 4, October 5, November 10, December 12.
Now that we have analyzed the data in the line graph, let’s answer some more questions about the line graph.
How much rain fell in January?
- 15 inches
- 10 inches
- 5 inches
- 8 inches
Correct! 15 inches fell in January.
Look at the dot above January. Which number is it across from?
Look at the dot above January. Which number is it across from?
Look at the dot above January. Which number is it across from?
Which month had 5 inches of rainfall?
- September
- November
- October
- August
Look at the horizontal line with the number 5. Which month is the dot on that line above?
Look at the horizontal line with the number 5. Which month is the dot on that line above?
Correct! Ocotober had 5 inches of rainfall.
Look at the horizontal line with the number 5. Which month is the dot on that line above?
Which months have MORE than ten inches of rain? Choose all correct answers.
- January
- February
- March
- April
- May
- June
- July
- August
- September
- October
- November
- December
Look at the horizontal line next to the number 10. Which dots are above the ten? What months do they represent?
Look at the horizontal line next to the number 10. Which dots are above the ten? What months do they represent?
Correct! January, February, April, May and December had more than ten inches of rain.
Summary
Questions answered correctly:
Questions answered incorrectly:
We can use line graphs to track changes in data over time. Let’s see what other information we can find using line graphs.