Create Pictographs
Goal:
Goal:

How do you show information with pictures?
There are many different ways to show information by using charts and graphs. You could use a pie chart to show how you spend your time after school. You could use a tally chart to show how often you help with chores. You could also use a picture graph, which is a fun way to show information by using images. Picture graphs are also known as pictographs. Let's look at some examples.
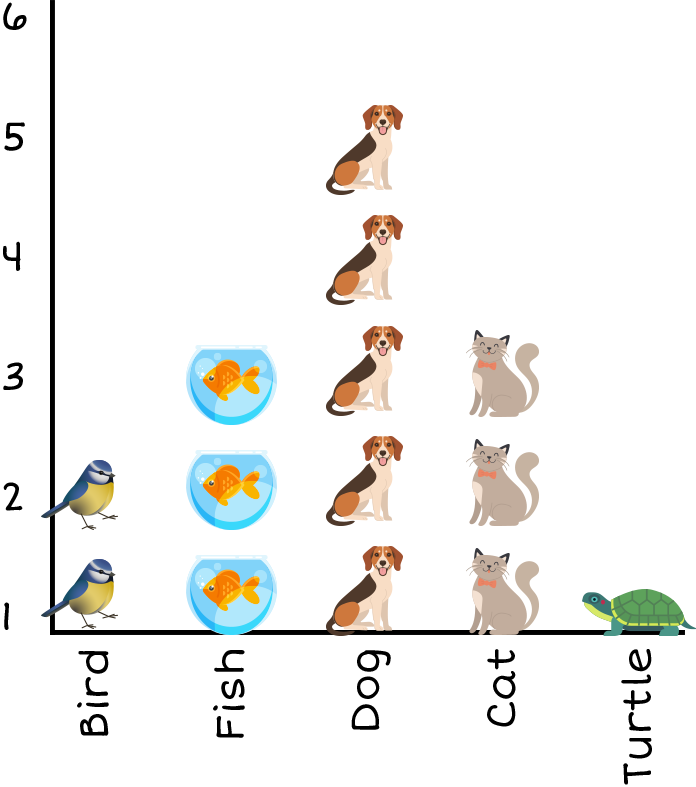
This picture graph shows images of pets vertically, or up and down.
Our Pets
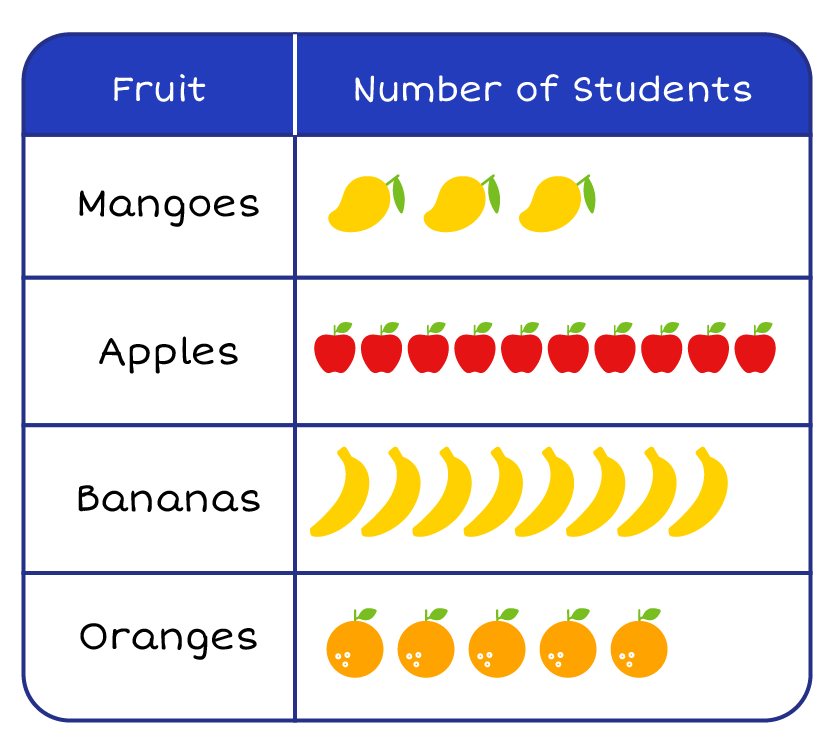
This pictograph shows pictures of fruit horizontally, or left to right.
Fruits Eaten
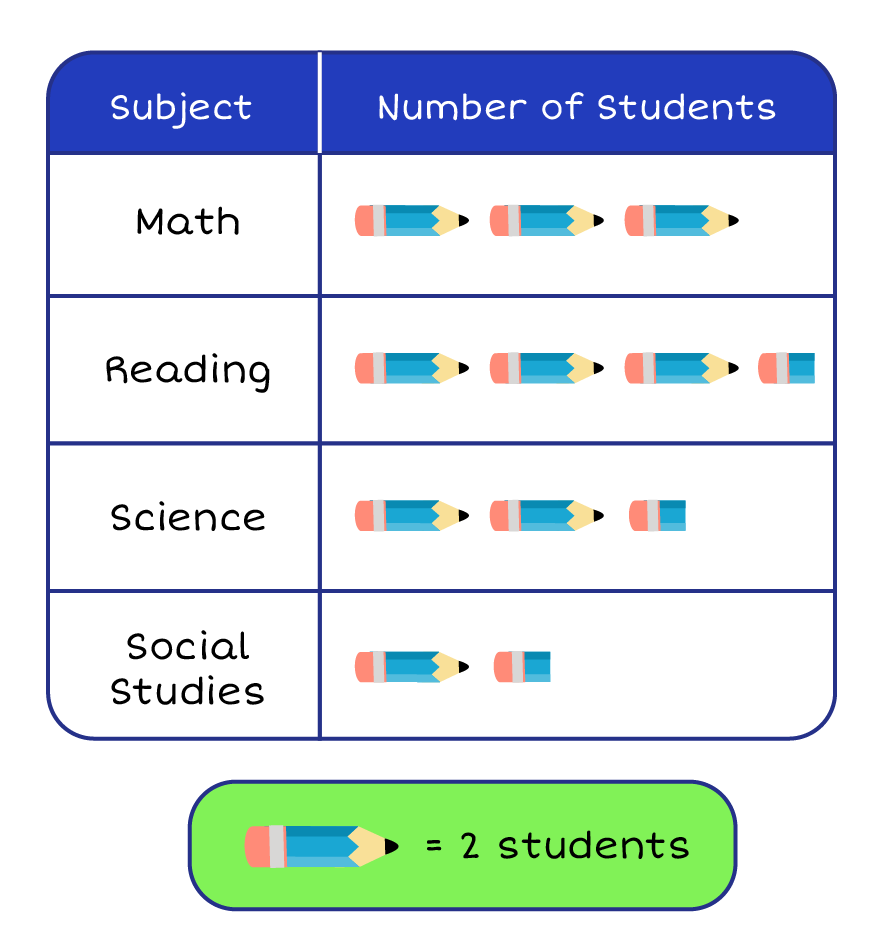
Some picture graphs have a key that tells how many items each picture stands for. If a picture graph does not have a key, each picture stands for one item.
Favorite Subjects
Look at the top of each pictograph. What do you see? That's right! Each pictograph has a title that tells you what the graph is showing. This is similar to the titles of some books. Do you think you could make your own picture graph? Click the arrow to watch a video about creating picture graphs.