Here is an example of a scatter plot.
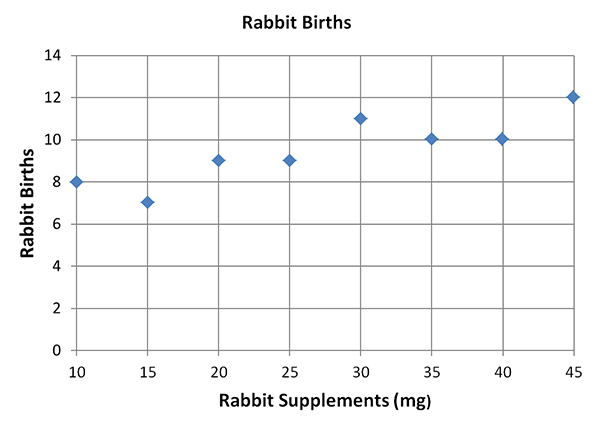
Download it by clicking the Activity button.
You may have noticed from the data points that it has a strong positive correlation. A positive correlation exists when as one variable increases, the other variable also increases and vice versa. Think of a positive correlation as a relationship between two variables in which both variables move in tandem.
Another way to look at the data is to talk about it's association. Let's define this term.
Association
An association is a relationship between two data sets. For example, there is a relationship that you found between age and height.
An association or relationship might be:
|
An association might be linear or non-linear.
A linear association would be a scatter plot where the data points look like they form a line.
The key here is that the data points may not actually form a straight line.
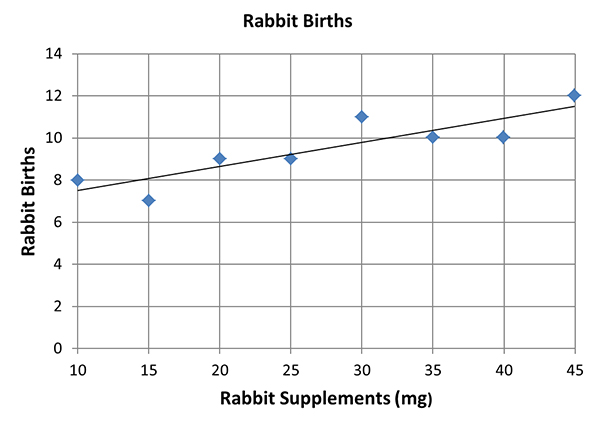
You could draw a straight line through the data points called a line of best fit.
This line of best fit allows predictions about the data.
For example, to approximate a line from the scatter plot above, you can find points on the line of best fit.
Using the scatter plot you printed, draw a straight line that you think would best represent the data. Check to see how your line compares with the one below.