Before you take a scored quiz for this lesson, try this set of practice questions. How well you score on this self-check will be similar to your scored quiz. If you do not score well on this self-check, please review this lesson and try again.
When do you know if a linear model is an appropriate model for your data?
- If the points in the residual plot are all in a straight line.
- If the points in the residual plot are scattered.
- If the points in the residual plot are all close to the vertical axis.
- If the points in the residual plot are all close to the horizontal axis.
If the points in a residual plot are randomly dispersed around the horizontal axis, a linear model is appropriate for your data set. If not, a non-linear model is appropriate.
If the points in a residual plot are randomly dispersed around the horizontal axis, a linear model is appropriate for your data set. If not, a non-linear model is appropriate.
If the points in a residual plot are randomly dispersed around the horizontal axis, a linear model is appropriate for your data set. If not, a non-linear model is appropriate.
You are correct!
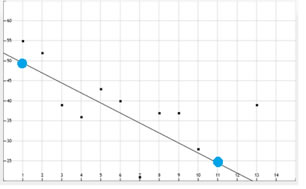
Find the line of best fit for the following set of data:
| Day | Units Produced |
| 1 | 55 |
| 2 | 52 |
| 3 | 39 |
| 4 | 36 |
| 5 | 43 |
| 6 | 40 |
| 7 | 21 |
| 8 | 37 |
| 9 | 37 |
| 10 | 28 |
| 11 | 25 |
| 12 | 5 |
| 13 | 39 |
| 14 | 16 |
| 15 | 10 |
- y = -6.2x + 55
- y = -2.6x + 52.7
- y = 6.2x – 55
- y = 2.6x - 52.7
y = -2.6x + 52.7
You are correct!
y = -2.6x + 52.7
y = -2.6x + 52.7
What is a linear association?
- A scatter plot where all of the data points are drawn.
- A scatter plot where at least two data points can be drawn.
- A scatter plot where the data points look like a line.
- A scatter plot where the data points form a horizontal line.
A linear association is a scatter plot where the data points look like they form a line, but may not actually form a straight line. You could draw a straight line through the data points called a line of best fit.
A linear association is a scatter plot where the data points look like they form a line, but may not actually form a straight line. You could draw a straight line through the data points called a line of best fit.
You are correct!
A linear association is a scatter plot where the data points look like they form a line, but may not actually form a straight line. You could draw a straight line through the data points called a line of best fit.
Which of the following describes a linear association?
- All points must form a straight line.
- A line can be drawn through at least two of the points.
- A line can be drawn through the data points which approximates the data.
- A horizontal line can be drawn such that all the data points are below it.
A linear association would be a scatter plot where the data points look like they form a line, but may not actually form a straight line. You could draw a straight line through the data points called a line of best fit.
A linear association would be a scatter plot where the data points look like they form a line, but may not actually form a straight line. You could draw a straight line through the data points called a line of best fit.
You are correct!
A linear association would be a scatter plot where the data points look like they form a line, but may not actually form a straight line. You could draw a straight line through the data points called a line of best fit.
Summary
 Questions answered correctly:
 Questions answered incorrectly:

Association
Here is an example of a scatter plot.
Another way to look at the data is to talk about its association. Let's define this term.
An association is a relationship between two data sets. For example, there is a relationship that you found between age and height.
An association or relationship might be:
- positive (strong)
- negative (weak)
- zero (none)
An association might be linear or non-linear.
A linear association would be a scatter plot where the data points look like they form a line.
Association
Identify whether the association in each picture is positive or negative.
Question
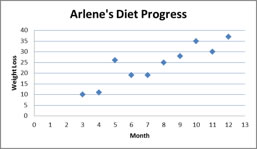
Is this association positive or negative?
This is a positive association because as the months increase so does the weight loss.
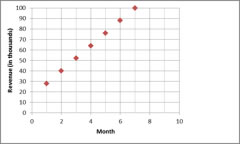
Question
Is this association positive or negative?
This is a positive association because as the months increase so does the revenue.
Association
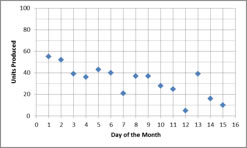
Question
Is this association positive or negative?
This is a negative association because as the months increase, the units produced decrease.
Residual Plots
Sometimes, a scatter plot is clearly a line and other times, it may be too hard to tell. We can determine whether a scatter plot is a line by sketching a graph called a residual plot.
A residual plot consists of residual values created from each point on a scatter plot. A residual value is the difference between the point (observed value) and the point that would appear on the line (predicted value) formed from the scatter plot.
The formula for finding the residuals in a scatter plot is:
Residual = Observed value - Predicted value for each point on the scatter plot.
Residual Plots
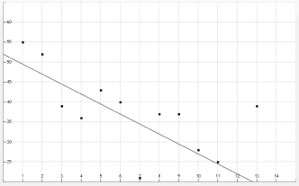
Study the example below for finding the residuals of the given scatter plot. First, we drew a line through points given on a scatter plot. This line is called the line of best-fit.
So, what is the purpose of finding the line of best-fit?
The line of best-fit enables you to make predictions about the data. With a line of best-fit, you can find an equation which could be used to plug data values into. So, it's definitely worth the work it takes.
In this example, we think that the line is a "best-fit" but need to make sure.
First, let's construct a table of the observed values and the predicted values.
Note: The observed values come from the points on the scatter plot. The predicted values come from the straight line drawn from the scatter plot.
Residual Plots
To find the predicted values, we need to have the equation of the line that we can plug the values 1 through 15 into. Click the answer button to see how to get this:
Step 1
Start, by identifying any two points on the line.
We found (1, 50) and (11, 25)
Step 2
Find the slope using those two points. Find the equation using the point-slope formula.
y - 25 = -2.5(x - 11)
y - 25 = -2.5x + 27.5
y = -2.5x + 52.5
Residual Plots
Now that we have the equation, plug the values 1 through 15 into the equation to get the predicted value. Click on the numbers in the second column to see the predicted values.
| Observed Value | Predicted Value | |
| Day | Units Produced | |
| 1 | 55 | 50 |
| 2 | 52 | 47.5 |
| 3 | 39 | 45 |
| 4 | 36 | 42.5 |
| 5 | 43 | 40 |
| 6 | 40 | 37.5 |
| 7 | 21 | 35 |
| 8 | 37 | 32.5 |
| 9 | 37 | 30 |
| 10 | 28 | 27.5 |
| 11 | 25 | 25 |
| 12 | 5 | 22.5 |
| 13 | 39 | 20 |
| 14 | 16 | 17.5 |
| 15 | 10 | 15 |
Residual Plots
Click on the numbers in the third column of the table to see the residual points we need to plot.
| Observed value | Predicted value | Residuals | |
| Day | Units Produced | ||
| 1 | 55 | 50 | 5 |
| 2 | 52 | 47.5 | 5 |
| 3 | 39 | 45 | -6 |
| 4 | 36 | 42.5 | -7 |
| 5 | 43 | 40 | 3 |
| 6 | 40 | 37.5 | 3 |
| 7 | 21 | 35 | -14 |
| 8 | 37 | 32.5 | 5 |
| 9 | 37 | 30 | 7 |
| 10 | 28 | 27.5 | 1 |
| 11 | 25 | 25 | 0 |
| 12 | 5 | 22.5 | -18 |
| 13 | 39 | 20 | 19 |
| 14 | 16 | 17.5 | -2 |
| 15 | 10 | 15 | -5 |
Residual Plots
Now let's create the residual plot from the table on the previous page.
Create the residual points by using the first column for the x-value or independent variable and the second column with the residuals for the y-value.
| x | y | residual points |
| 1 | 5 | (1,5) |
| 2 | 5 | (2,5) |
| 3 | -6 | (3,-6) |
| 4 | -7 | (4,-7) |
| 5 | 3 | (5,3) |
| 6 | 3 | (6,3) |
| 7 | -14 | (7,-14) |
| 8 | 5 | (8,5) |
| 9 | 7 | (9,7) |
| 10 | 1 | (10,1) |
| 11 | 0 | (11,0) |
| 12 | -18 | (12,-18) |
| 13 | 19 | (13,19) |
| 14 | 16 | (14,-2) |
| 15 | -5 | (15,-5) |
Residual Plots
Now, let's plot the points. A residual plot is a graph that shows the residuals on the vertical axis and the independent variable on the horizontal axis.
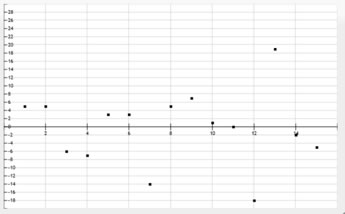
Now, if the points in a residual plot are randomly dispersed around the horizontal axis, a linear model is appropriate for your data set. If not, a non-linear model is appropriate. Notice how the majority of the points hover near the x-axis.
If you go back to the beginning…the line drawn IS appropriate for the data values in the scatter plot.
———
Now that you have had some more practice, you should be better prepared for your quiz. If you still do not feel confident about any topics, please contact your teacher for some additional help.
