 Now that you've seen how to create a residual plot and use it for best-fitting a line, here's an example to step through.
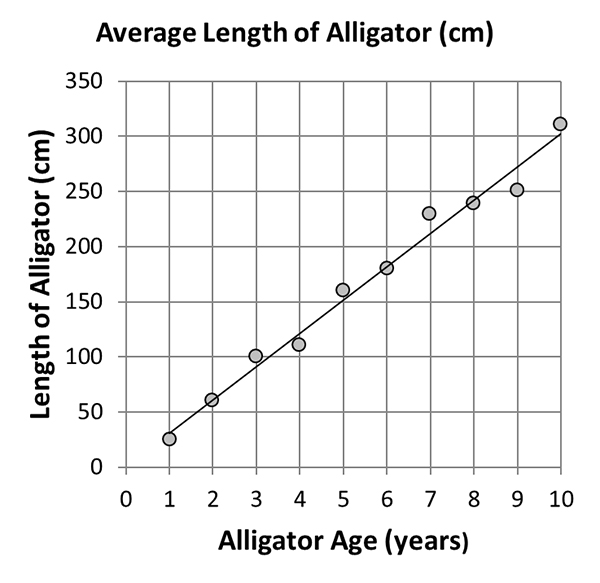
Male alligators in Louisiana can grow up to 4 meters long. Here is a table showing the age and average length of alligators caught and measured for one season in one bayou.
| Age | Average Length (cm) |
| 1 | 25 |
| 2 | 60 |
| 3 | 100 |
| 4 | 110 |
| 5 | 160 |
| 6 | 180 |
| 7 | 230 |
| 8 | 240 |
| 9 | 250 |
| 10 | 310 |
In your notebook, complete each question by clicking on each tab.
Drawing a
best-fit line
Write the equation
for the best-fit line
Create a table
of residual values
Create a graph of
the residual values
A. Plot the points into a scatter plot and draw a best-fit line.
B. Write the equation for your best-fit line. (Hint: Identify two points on the line. Find the slope. Then, use one point and the slope to find the equation.)
The best-fit line drawn in the previous tab passes through points (5, 150) and (10,300) This can be use to write the equation for the best-fit line.
y = mx + b
m = \(\mathsf{ \frac{y^2-y^1}{x^2-x^1} }\) = \(\mathsf{ \frac{300-150}{10-5} }\) = 30
Calculate b; 300 = 30(10) + b; b = 0
y = 30 x + 0 is the equation for the best-fit line shown here.
C. Complete the table below by Subtracting the values of the points from your best-fit line from the measured lengths.
| Age | Average Length (cm) |
Calculated Points from Best-Fit |
Residual |
| 1 | 25 | 30 | |
| 2 | 60 | 60 | |
| 3 | 100 | 90 | |
| 4 | 110 | 120 | |
| 5 | 160 | 150 | |
| 6 | 180 | 180 | |
| 7 | 230 | 210 | |
| 8 | 240 | 240 | |
| 9 | 250 | 270 | |
| 10 | 310 | 300 |
| Age | Average Length (cm) |
Calculated Points from Best-Fit |
Residual |
| 1 | 25 | 30 | -5 |
| 2 | 60 | 60 | 0 |
| 3 | 100 | 90 | 10 |
| 4 | 110 | 120 | -10 |
| 5 | 160 | 150 | 10 |
| 6 | 180 | 180 | 0 |
| 7 | 230 | 210 | 20 |
| 8 | 240 | 240 | 0 |
| 9 | 250 | 270 | -20 |
| 10 | 310 | 300 | 10 |
D. Create a residual graph. Use the table of values you completed in part C.
Also, what does the residual graph tell you about the "goodness of fit" of the best-fit line? In other words, how good is the best-fit line?
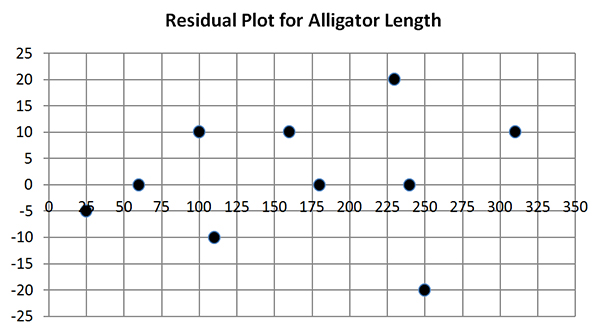
The scatterplot of the residuals shows that the best-fit line is acceptable because the points are spread out and don’t form a pattern like a line or a parabola.
