Let's Break it Down
Exponential decay defines a relationship between the initial value of a phenomenon and its decay factor over time. You have used graphs to show how the values change over time. You have also written functions to describe exponential decay.
Exponential Decay Function
\( f(x) = a \cdot b^x \)
a = initial value, \( a \neq 0 \)
b = decay factor, \( 0 < b < 1 \)
x = variable
How is the graph of an exponential decay function related to the function itself? Consider the domain and range of an exponential decay function.
Consider the exponential decay function \( f\left( x \right) = \frac{1}{2}^{x} \), shown below.
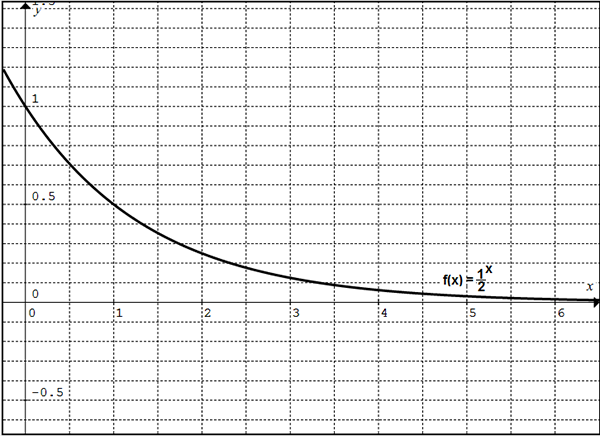
Look at the function and its graph. The graph gives you a visual representation of all the values that make the function true.
You can substitute any value for x into the function and have a real value returned, so the domain of this, and of all exponential decay functions, is all real numbers.
What about the range? Look at the graph. The curve approaches, but never touches or dips below, the horizontal axis. This means that the value of the output can never be negative, so the range is all positive real numbers.
This information may seem familiar to you. It's because the mathematical domain and range of an exponential decay function is the same as the mathematical domain and range of an exponential growth function.
Question
What are the domain and the range of the exponential decay function shown on this graph?

The domain is all real numbers. The range is all real positive numbers.
Question
The function that describes the curve below is \( f\left( x \right) = 8 \cdot \frac{1}{2}^{x} \). What do you notice about the function and the y-intercept of the graph?
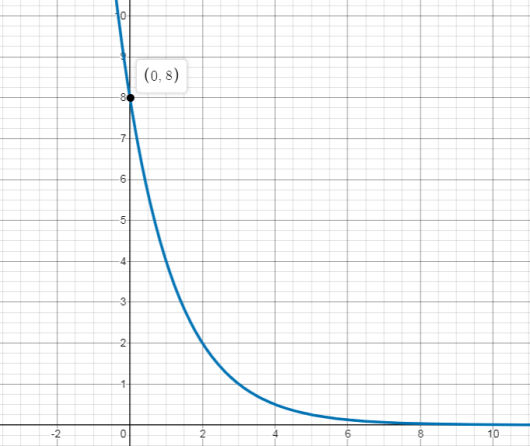
The curve passes through the y-axis at the initial value.
