Show your skills!
Exponential decay is all around us. This type of change can describe how radioactive isotopes decay, how populations decrease, and how the value of purchases decline as the independent variable moves steadily upward. Usually the independent variable represents time, but it can sometimes represent another unit.
You have learned how to graph exponential decay functions and how to write the function that describes the curve. You also know how to read the graph to find the domain and range of an exponential decay function.
Use the activity below to put all these skills together. Read the scenario on each tab and then answer the questions that follow. Remember to carefully consider the domain and range of each function within the context of the scenario it represents. Be sure to click each question to check your answer.
Every year, a high school holds a tennis tournament. The tournament starts with 64 players, and ½ of the players are eliminated after each round. The graph that represents the number of players remaining after each round is shown.

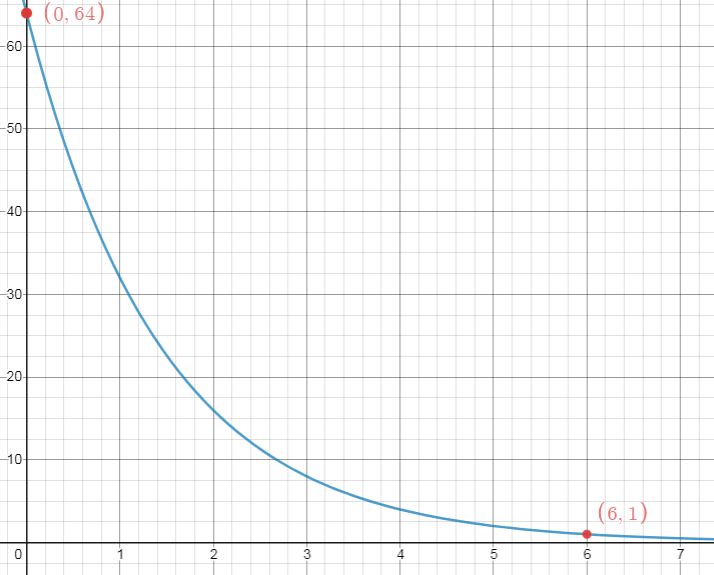
Read the graph. The curve passes through the point (6, 1). Since the horizontal axis represents the number of rounds and the vertical axis shows the number of players remaining, it will require 6 rounds of play to declare a winner.
The function that describes this curve is \( f\left( x \right) = 64 \cdot \frac{1}{2}^{x} \). The mathematical domain for this function is all real numbers, but in this scenario, the negative values of x do not make sense, since there cannot be a "negative" match number. The domain is x ≥ 0. The tournament starts with 64 players, and that is the maximum range. The minimum is 0, but the curve never reaches that value. You can express the range as \( 0 < y \leq 64 \).
Angelo is getting better at baking cookies. It took him 120 minutes to make his first batch. Each time he makes them after that, he reduces his time by \( \frac{1}{6} \). The graph that represents the time it takes for Angelo to bake each batch of cookies is shown.

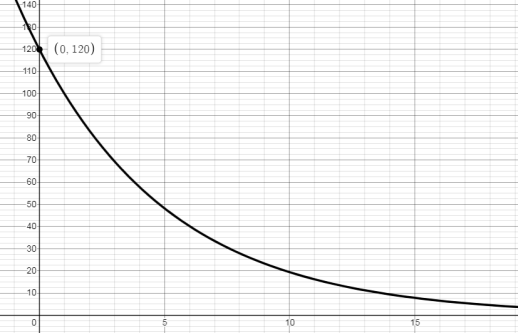
The y-intercept is (0, 120). The y-intercept is the same as the initial value of the function.
The function that describes this exponential decay curve is \( f\left( x \right) = 120\left( \frac{5}{6} \right)^{x} \). The x value represents the number of batches that Angelo bakes, thus it cannot be negative, and the domain is x ≥ 0. The mathematical range is \( 0 < y \leq 120 \), but think about the process of baking cookies. Realistically, a person could refine their process and reduce their time to a point, but then they would not be able to decrease their time further. At that point, the situation would no longer be modeled by an exponential decay function.
Handan's parents bought her a car for $16,500 and expect that the car will lose approximately 25% of its value each year. The graph that represents the value of the car as time passes is shown.

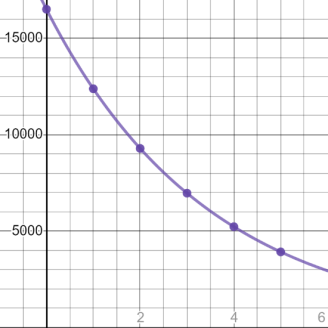
The exponential decay function that describes this curve is \( f(x) = 16,500 \cdot 0.75^x \). Since x represents the number of years, it cannot be negative, and the domain is \( x \ge 0 \). The f(x)-values represent the value of the car in dollars. Since the car was purchased for $16,500, the value will never be higher than $16,500, and you can describe the range mathematically as \( 0 < y \leq 16500 \).
You can read the graph, or you can evaluate the function, \( f(x) = 16,500 \cdot 0.75^x \), at x = 7. |
\( f\left( x \right) = 16500 \cdot {0.75}^{x} \) \( f\left( 7 \right) = 16500 \cdot {0.75}^{7} \) \( f\left( 7 \right) = \$ 2,202.48 \) |
