
Let's Investigate
In this investigation you will use a simulation to explore the relationship between the angle of incidence and the angle of reflection for a flat mirror. Using the simulation, you will shine light from different angles onto a mirror and measure the angle of incidence and angle of reflection. By the end of this lab activity, you will be able to answer the question “What is the relationship between the angle of incidence and the angle of reflection?” using data to support your answer.
Once you have completed the experiment, you will communicate the results by writing a laboratory report. You will create your laboratory report in a word- processing program.
Attribution: PhET Interactive Simulations | University of Colorado | https://phet.colorado.edu
The instructions, the laboratory report requirements, and the rubric that will be used to grade the report are shown on the tabs below. Click the button below to download the instructions OR read and follow the steps on the first tab to complete the investigation.
Laboratory Instructions
Laboratory
Report
Grading
Rubric
Click the “Intro” mode to begin this investigation. Before you begin, set up a data table with places to record the angle of incidence and the angle of reflection for three trials.
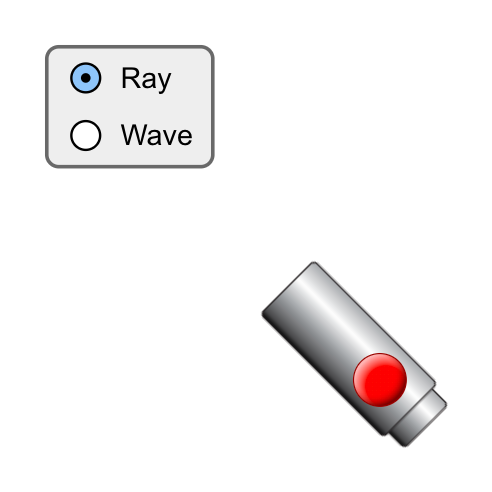
- The screen that first appears in this mode has a light source with a red button on it. In the upper left corner, there is area to choose how the light will be modeled. Select “Ray.”
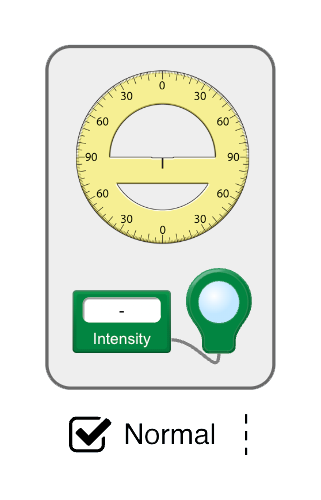
- On the lower left are two tools. You will use the protractor in this investigation. Below the tools is a section to select “Normal.” When this is selected, the normal line is shown. This is the dashed line that is perpendicular to the surface. Leave this as the default (checked).
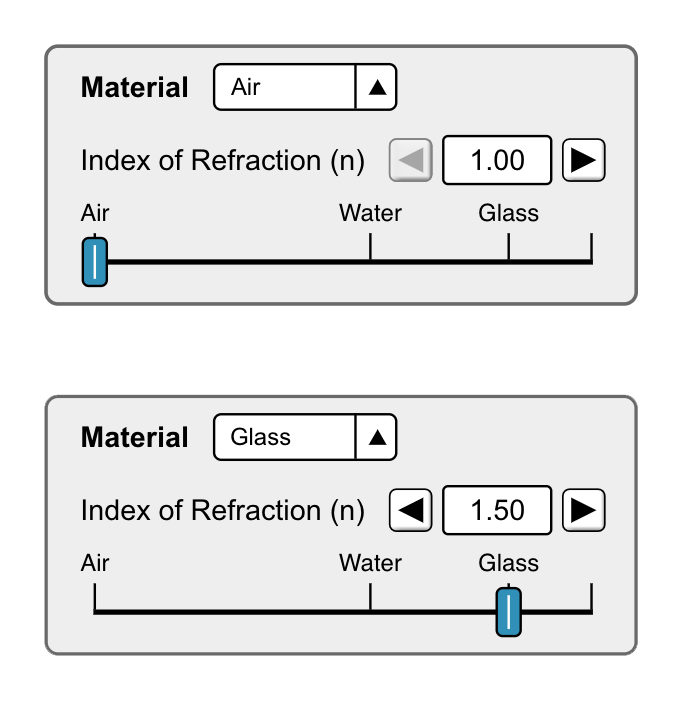
- On the right are two areas to select the material the light is traveling through and the material the light is hitting. To simulate a mirror, keep the top material as “Air” and change the bottom material to “Glass.”
- To produce a light wave, click on the red button on the light source.
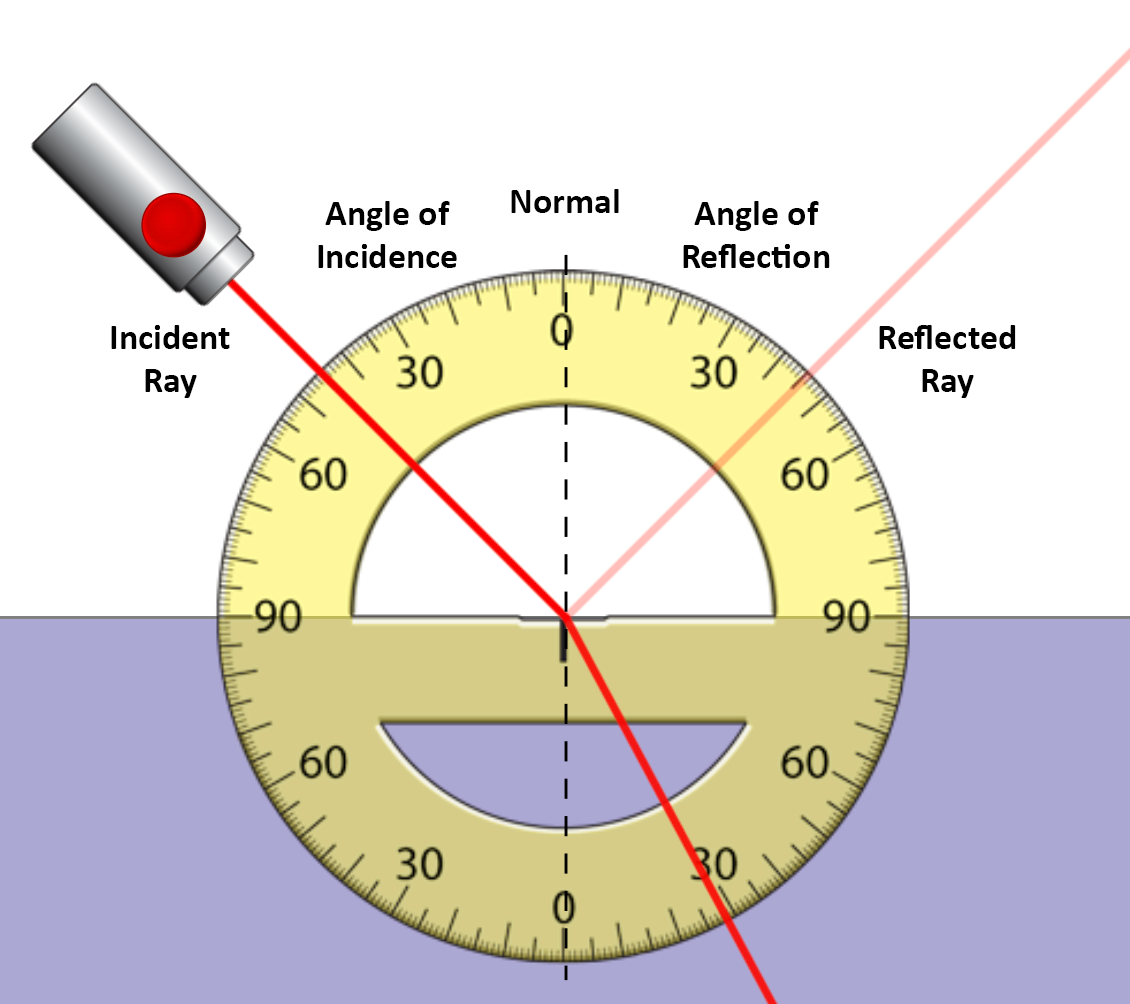
- The angle of incidence is the angle between the ray produced by the light source and the normal (the dashed line). Measure this angle by dragging the protractor so that the tick mark in the center of the protractor and the 0° marks on the protractor all line up with the normal. Record this angle on a data table.
- The angle between the ray that is reflected and the normal is the angle of reflection. Measure this angle as you did the angle of incidence. Record this angle on your data table.
- Click on the light source and drag it to a new angle. Measure the angle of incidence and the angle of reflection and record them on your data table.
- Measure the angles of incidence and reflection for two more angles and record them in your data table.
- Write a lab report in which you answer the question “What is the relationship between the angle of incidence and the angle of reflection?”
For this experiment, you will be writing a formal laboratory report. Make sure to review the parts of a laboratory report and include each of these sections in your submission.
| Title | The title of the laboratory report tells the reader what you did in the experiment. Make it brief but include enough information to help the reader understand what was tested. |
| Introduction |
The first part of the introduction summarizes the
purpose of the experiment. This part is likely going
to be only a paragraph in length. The second part of the introduction provides a summary of the background information that is needed to understand the experiment. In other words, this is a brief report on the background research that you performed to define the problem and design the experiment. The last part of the introduction is a statement of your hypothesis. |
| Materials | This section is simply a list of the materials that are needed to perform the experiment. Remember, one of the goals of communication is to allow for another person to repeat your experiment, so be specific and thorough. |
| Procedure and Methods | This section should describe the methods and procedures used to perform the experiment. It should include a description of how to control the experiment as well as when and how to take measurements and observations. You can include a diagram of the setup if it is helpful to the reader. |
| Data | This section includes the raw data that was collected when the experiment was completed. Make sure the data is organized and presented in data tables that are easily read and understood. In this section, do not discuss the results... that comes later. |
| Analysis and Results | This is where you discuss the results of the experiment. The data section contains the raw data and this section would contain any calculations (like averages) that were made. In this section is where you interpret the data. You will refer to any figures and graphs in this section using numerical references (i.e. Figure 1, Graph 1). |
| Conclusions | The conclusion is a simple summary of what happened in the experiment. Discuss whether or not the data supported the hypothesis or not. Also, include a discussion on any unexpected error that was introduced into the experiment and how you might improve the experiment if doing it again. |
| Figures and Graphs | Use this section to display any graphs that you create from the data and analysis of the data. In the case of the paper airplane lab, a graph would include the paper weight on the x-axis and the distance flown on the y-axis as a line graph. This would show the relationship between the independent variable and the dependent variable. Make sure to label these with numbers to reference in your Analysis and Results section. This laboratory should include a graph that compares mass to acceleration. |
| References | The last thing you need to provide is any references you used for your background research. You should include at least two or three creditable resources, if not more. |
Take a look at the laboratory report rubric that will be used to grade this report. Once you have finished writing your laboratory report, turn it in to your teacher.
|
Report Components |
All required elements are present and additional elements that add to the report (e.g., thoughtful comments, graphics) have been added. |
|
Purpose |
The purpose of the lab or the question to be answered during the lab is clearly identified and stated. |
|
Background Information |
Report illustrates an accurate and thorough understanding of scientific concepts underlying the lab. |
|
Materials, Procedures |
All materials and setup used in the experiment are clearly and accurately described. |
|
Methods |
Procedures appear to be replicable. Steps are outlined sequentially and are adequately detailed. |
|
Data, Graphs, and Figures |
Professional looking and accurate representation of the data in tables and/or graphs. Graphs and tables are labeled and titled. |
|
Analysis |
The relationship between the variables is discussed and trends/patterns logically analyzed. Predictions are made about what might happen if part of the lab were changed or how the experimental design could be changed. |
|
Conclusion |
Conclusion includes whether the findings supported the hypothesis, possible sources of error, and what was learned from the experiment. |
|
References |
Several reputable background sources were used and cited correctly. Material is translated into student's own words. |
