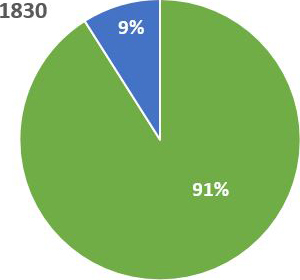
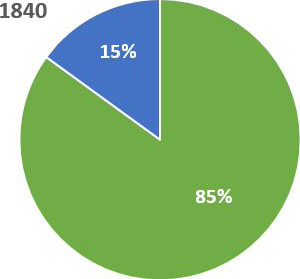
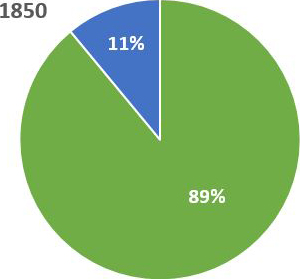
A circle graph is useful in comparing parts of a whole. The entire circle stands for the whole thing, or 100 percent of something. The sections represent the parts that make up the whole. Urban refers to cities, and rural refers to the countryside.
| Urban and Rural Population, 1830 - 1860 | |
 |
 |
 |
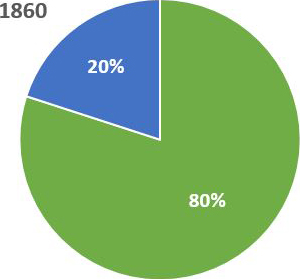 |
Use the four circle graphs to answer these questions. Click each question to reveal its answer.
| Question | Answer |
|---|---|
| What do the four graphs show? | the breakdown of urban and rural populations from 1830 to 1860 |
| What percentage of people lived in rural areas in 1830? | 91% |
| What percentage of people lived in rural areas in 1860? | 80% |
| During which two decades did the number of people living in urban areas increase by about five percent? | 1840–1850 and 1850–1860 |
| What conclusion can you draw from the graphs about the relationship of rural dwellers to urban dwellers from 1830 to 1860? | Although a far greater percentage of people lived in rural areas in 1860, the percentage of people living in urban areas was steadily increasing. |
