Let's Review
What have you learned about visual ways of presenting information?
Goal:
Goal:
Use the activity below to see how well you can "read" the visual elements that often appear in informational text.
Use the time line to answer this question.
How many days passed between the Titanic's sinking and the survivors' arrival in New York?
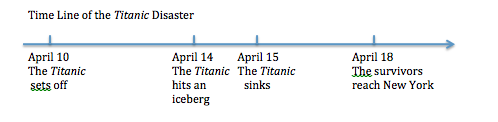
three days
Use this pie chart to answer the question.
What fruit did people like most? And which one did they like the least?

People like apples the most, and pineapple the least.
Use this map to answer the question.
How many tornadoes took place in California in 2009?

two
Use this graph to answer the question.
Which month was hotter, April or May?
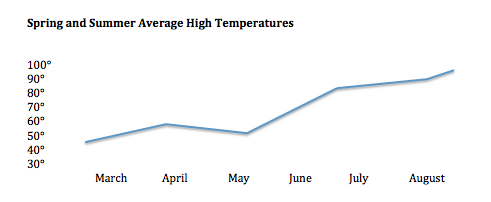
April
Use this diagram to answer the question.
Where is the eye of a hurricane?
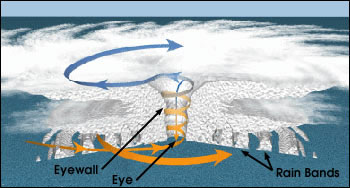
in the center
Summary
 Correct:
 Incorrect: